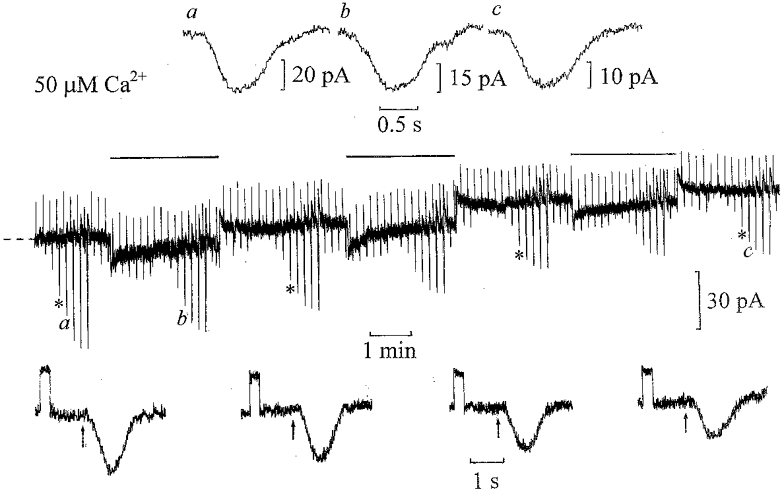
Figure 2. Desensitization of ‘on’ bipolar cells by 50 μm Ca2+.

Whole-cell voltage-clamp recording from an ‘on’ bipolar cell with the patch pipette solution containing 50 μm Ca2+ buffered with 5 mm TPEN. The flash intensity was increased by factors of two from 0.125 to 16 Rh** in the dark, and against dim 0.5 Rh** s−1 backgounds. The dim test flash intensity before and during the steps was 0.5 Rh**. The cell was voltage clamped to its dark potential of −39 mV. The current responses to 1 mV voltage commands and responses to 1 Rh** flashes are shown below on expanded time scales at the same gain. On equilibration with 50 μm Ca2+ there was a decrease in input conductance from 25 to 19 nS with an outward shift in dark current of 26 pA. Responses to 2 Rh** flashes shown above the trace (flashes applied at the beginning of each record) were scaled to the same amplitudes in the dark (a) against the background (b) and on equilibration with 50 μm Ca2+ in the dark (c).
