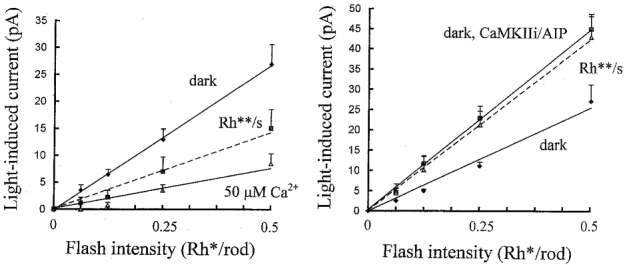
Figure 7. Flash intensity-inward current response relations plotted on linear flash intensity axes, showing absolute changes in flash sensitivity.

The same data from Fig. 6 was plotted on linear flash intensity axes up to 0.5 Rh**, showing the linear range of light-induced inward currents in the dark and against 0.5 Rh** s−1 backgrounds, without illustrating the shifts in current in response to the backgrounds. Left graph: light-induced current responses measured just after achieving whole-cell clamp (initial) in the dark (diamonds), against 0.5 Rh** s−1 backgrounds (squares) and in the dark on equilibration with 50 μm Ca2+ (triangles). Corresponding flash sensitivities, obtained from the slopes of the linear regression lines, were 53, 29 (Student’s t test, significant difference from dark, P < 0.05) and 15 pA Rh**−1 (t test, significant difference from dark initial, P < 0.01) (n= 5). Right graph: responses measured just after achieving whole-cell clamp (initial) in the dark (diamonds), on equilibration with the CaMKII inhibitor peptides in the dark (squares) and against 0.5 Rh** s−1 backgrounds (triangles) with either 50 μm Ca2+ or no Ca2+ buffer. Corresponding flash sensitivities were 51, 90 (t test, significant difference from initial, P < 0.05) and 84 pA Rh**−1 (not significantly different from the dark on equilibration with CaMKII inhibitors) (n= 7). A correction was applied to the 0.5 Rh** flash responses on equilibration with the CaMKII inhibitors because these were outside the linear response range. These have been corrected for non-linearity using the third-order expansion for a rectangular hyperbola.
