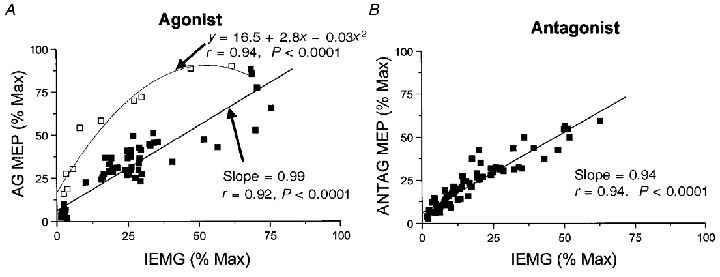
Figure 6. Relationships between the amplitude of the MEPs and IEMG when muscles functioned as the agonist (A) and antagonist (B).

A, a linear regression was performed and a line of best fit drawn through agonist muscle data points from −180 to −70 ms and −10 to 180 ms (▪). Data points correspond to normalised responses averaged across subjects for both FCR and ECRL. The fit of the line to these data was highly significant (r = 0.92, P < 0.0001). Data points from −60 to −20 ms (□) were best fitted by a second-order polynomial function (r = 0.94, P < 0.0001). B, a linear regression was conducted and a line of best fit drawn through all antagonist muscle data points (-180 to 180 ms). A linear relationship (r = 0.94, P < 0.0001) between the antagonist MEPs and IEMG was maintained throughout the movement.
