
Figure 2. Inward currents in a single cultured HISM cell.
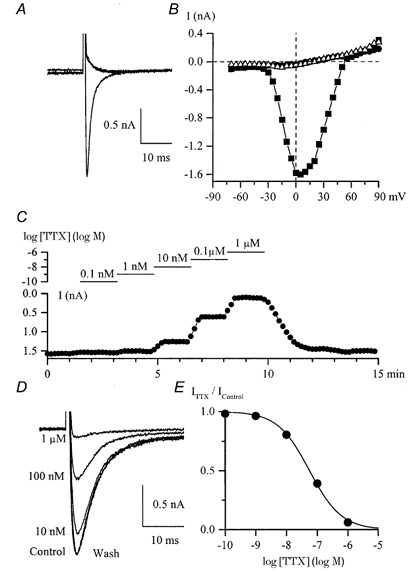
A, superimposed current traces elicited by depolarizing pulses to 0 mV from −100 mV in control (135 mm Na+, 2.5 mm Ca2+) and after replacement of Na+ by Cs+ (125 mm) with 10 mm CaCl2 or BaCl2 added to the external solution. B, I-V relationships for the peak inward current in control (bull) and high-Cs+ external solution with 10 mm Ca2+ (•) or 10 mm Ba2+ (▵) in the same cell. C, peak inward Na+ current was measured at +10 mV by applying voltage steps from −100 mV every 10 s upon cumulative application of ascending concentrations of TTX as shown by the horizontal lines on the logarithmic concentration scale. External solutions contained Na+ and Ca2+ but not Mg2+. D, examples of INa from the same experiment. The concentrations of TTX applied are indicated. E, concentration-effect curve for the experiment illustrated in C and D. Data points represent relative current (ITTX/IControl) fitted by the logistic function with an IC50 value of 56 nm. ITTX is the current in TTX.