
Figure 4. Recovery of INa from inactivation.
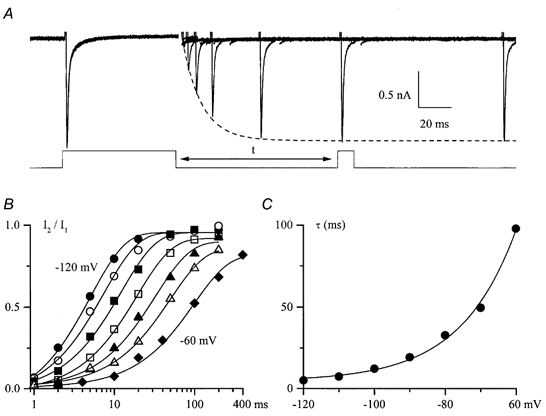
A, INa elicited by a 70 ms prepulse and a 10 ms test pulse to +10 mV applied from −100 mV with a variable interpulse interval, t (as shown below). Capacitance transients have been removed for clarity. Peak INa during the recovery process could be well fitted by a single exponential function with a time constant of 12.3 ms as shown by the dashed line. B, relative INa plotted against interpulse interval on a semilogarithmic scale at different membrane potentials (from left to right, −120 to −60 mV in 10 mV increments) and fitted by single exponential functions as shown by the continuous lines. C, voltage dependence of the time constant characterizing INa recovery from inactivation in a single experiment, fitted by a single exponential function with an e-fold increase in τ per 15.7 mV.