
Figure 10. Comparison of the voltage dependence of activation and inactivation of INa and IDA.
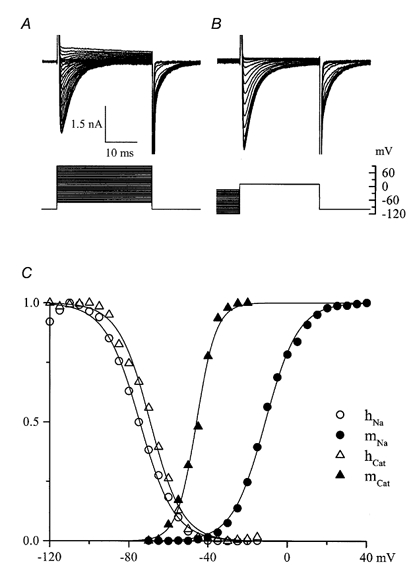
A and B, families of superimposed current traces and voltage protocols used to study the voltage dependence of activation (A) and inactivation (B). Measurements were made of INa at its peak and activation of IDA 30 ms after stepping to various potentials from a holding potential of −100 mV; at 30 ms INa is largely inactivated (cf. Fig. 3) but IDA is close to its peak value. In B the test potential was +10 mV, close to the reversal potential (Vrev) for IDA, thus minimizing its contribution during measurements of INa inactivation. Again, a 30 ms pulse allows INa to inactivate leaving IDA close to its peak value. C, open and filled circles show, respectively, normalized INa amplitude from B (hNa) and relative Na+ conductance calculated from INa amplitudes in A (mNa) as described for Fig. 3C, respectively. Filled and open triangles show relative tail current amplitudes from A (mCat) and B (hCat), respectively, measured by fitting single exponential functions and extrapolating to time zero at the end of each test pulse. Data points were fitted by Boltzmann functions with the following best fit parameters: INa activation: V1/2 = −11.1 mV; k = −8.3 mV; INa inactivation: V1/2 = −74.5 mV, k = 8.8 mV; IDA activation: V1/2 = −45.8 mV, k = −5.0 mV; IDA inactivation: V1/2 = −69.2 mV, k = 8.1 mV. This cell was in 130 mm Na+, divalent cation-free solution; IHA was small (-145 and +155 pA at −100 and +90 mV, respectively).