
Figure 11. I-V relationships for IDA.
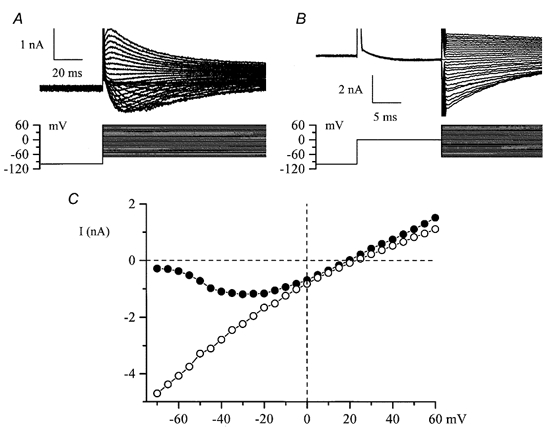
A and B, voltage protocols and superimposed current traces recorded in the same cultured HISM cell using high-Cs+ pipette and high-K+, divalent cation-free external solution in which INa is abolished and IDA can be measured. IHA was relatively small in this cell: measured by applying voltage ramps from −40 mV to inactivate IDA, IHA amplitude was −427 pA at −70 mV and 315 pA at +60 mV. In B steps were in the range −70 to +60mV. Tail current was flat at +20 mV. C, I-V relationships for the peak IDA in A (•) and instantaneous tail current amplitude in B (○), measured as described for Fig. 10B. Tail current reversed at +23 mV which was 3 mV more positive than the peak IDA reversal potential. This discrepancy could arise as a result of some contamination of the peak IDA by IHA, as explained above, for which Vrev 0 mV.