
Figure 3. Two types of steady-state inactivation behaviour of transient K+ current in non-β-cells.
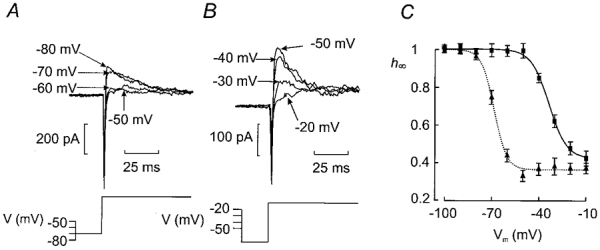
A and B (bottom), prior to a test pulse to −10 mV, the cells were subjected to a 200 ms conditioning pulse to voltages between −100 and −10 mV. The test pulse was preceded by an interval of 20 ms during which the cell was held at −70 mV as indicated schematically by the voltage protocol. Each sequence was repeated at a frequency of 0·4 Hz. A and B (top), the current responses following various conditioning pulses. For clarity, only the current responses following conditioning pulses to membrane potentials between −80 and −50 mV are shown in A and between −50 and −20 mV in B. Note that inactivation occurs at more depolarised voltages in B. C, relationship between conditioning voltage (Vm) and relative current amplitude (h∞ = I/Imax). Two subsets of cells were identified: one with inactivation occurring at negative membrane potentials (▴n = 14) and one with inactivation at more positive voltages (▪; n = 20). The current responses elicited by the depolarisation to −10 mV following a conditioning pulse to −100 mV were taken as Imax. Data are mean values ±s.e.m. The curves were obtained by fitting the Boltzmann equation (eqn (1)) to the data points.