
Figure 5. Characterisation of voltage-gated Na+ currents in pancreatic δ-cells.
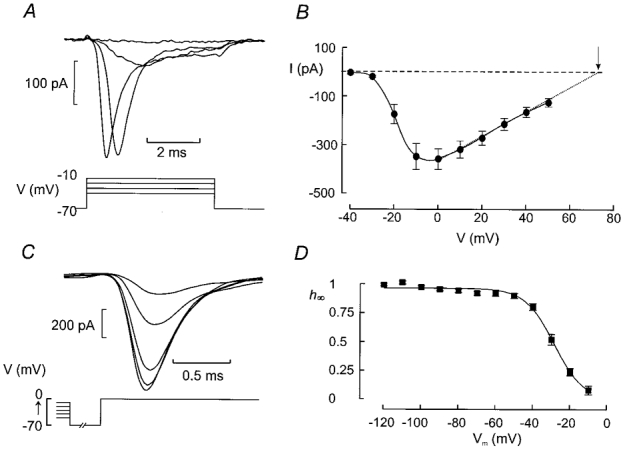
A, Na+ currents observed when the voltage was stepped from −70 mV to potentials between −40 and +50 mV in 10 mV increments (only first 4 pulses shown). The depolarisations were 5 ms long and applied at a frequency of ≈1 Hz. B, I-V relationship of the Na+ current in δ-cells as identified by the absence of an A-current. The dotted line and dashed horizontal line indicate the extrapolated I-V relationship and the zero current level, respectively. The arrow indicates the reversal potential. Data are mean values ±s.e.m. of 12 experiments. C, steady-state inactivation of the Na+ current in pancreatic δ-cells. The cells were subjected to a conditioning pulse (100 ms) to voltages between −120 and −10 mV prior to the 5 ms test pulse which was −10 mV. The cell was held at −70 mV for 1 ms between the conditioning pulse and the test pulse. Current responses shown are those obtained (from bottom to top) following a conditioning pulse to −50, −40, −30, −20 and −10 mV. D, relationship between conditioning voltage (Vm) and relative current amplitude (h∞=I/Imax). The current response elicited by a depolarisation to −10 mV following a conditioning pulse to −120 mV was taken as Imax. Mean values ±s.e.m. of 7 experiments. The curve was obtained by fitting the Boltzmann equation (eqn (1)) to the data points.