
Figure 3. Fractional Zn2+ current through muscle AChRs.
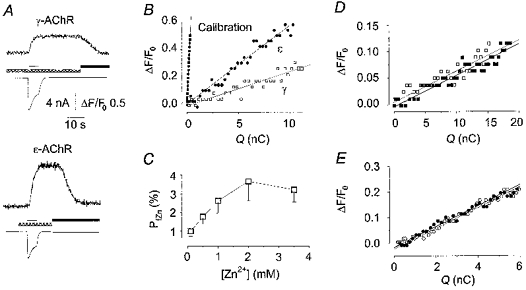
A, typical fluorescence and current responses evoked by nicotine (thin bar), simultaneously recorded in two cells expressing γ-AChR (top) and ε-AChR (bottom), equilibrated in Ca2+-, Mg2+-free solution containing Zn2+ (0.5 mm, cross-hatched bar). Note that the current response was terminated by nicotine washout, while fluorescence recovered to basal only upon TPEN application (filled bar). Membrane holding potential, -50 mV. B, plot of ΔF/F0vs. Q in the same cells as in A (□, γ-AChR; •, ε-AChR) and in a third cell used for calibration measurements (▪). Data points were calculated every 50 ms. The slopes of the straight lines, obtained by best fitting the data, represent the F/Q ratios of the responses. C, in cells expressing γ-AChR, Pf,Zn increased with Zn2+ concentration in the extracellular medium. Each point represents the mean ±s.e.m. of 6-11 cells. D, plot of ΔF/F0vs. Q in a cell loaded with Newport Green, with nicotine applied in the presence of ZnCl2 (0.5 mm, □), or ZnCl2 plus CaCl2 and MgCl2 (2 mm each, ▪). Note that the values virtually overlap. E, plot of ΔF/F0vs. Q in a cell loaded with Fluo-3, and superfused with nicotine in standard external solution (○) and in the presence of ZnCl2 (0.5 mm, •). Data points were obtained and fitted as in B.