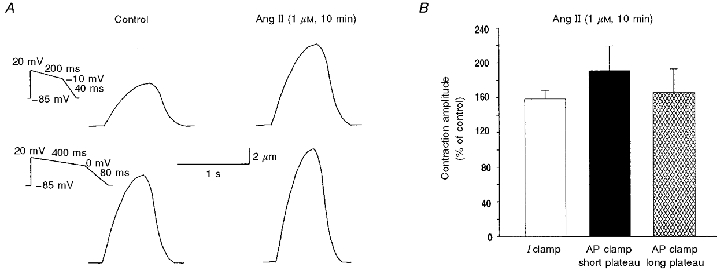
Figure 8. Effects of Ang II on contractions evoked by simulated voltage-clamped action potentials.

A, representative traces of cell shortening evoked by the voltage protocols shown on the left (voltage clamp), before and after 10 min of exposure of the myocyte to Ang II. B, mean percentage increase of peak shortening in relation to control for contractions evoked by current-clamp stimulus (Fig. 7, n = 8) and by voltage-clamp protocols simulating short and long action potentials (A, n = 6 and 5, respectively). No significant changes were observed among these groups.
