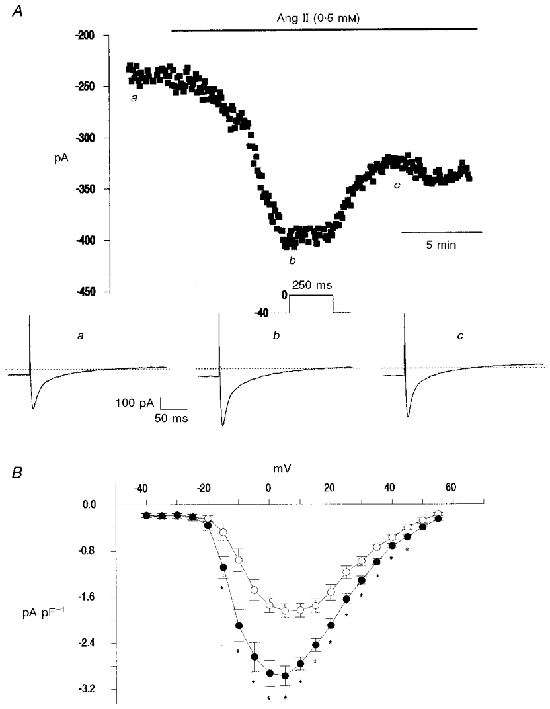
Figure 9. Ang II increases ICa.

A, time course of the effects of Ang II on peak ICa current evoked by a step to 0 mV in a single myocyte. Representative traces of ICa corresponding to the points indicated in the upper panel are shown below. B, current density-voltage relations for mean data of peak current density collected from six myocytes in the absence and the presence of Ang II. A significant increase in ICa was observed after application of Ang II to the bath solution.
