
Figure 1. Physical and functional coupling between ER and mitochondria in RBL-2H3 mast cells.
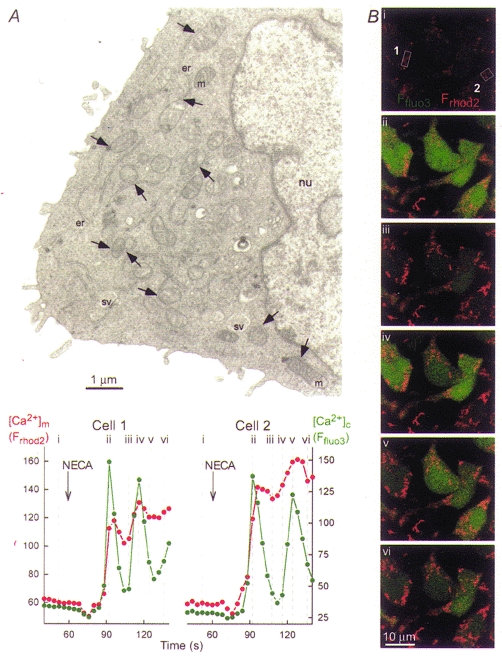
A, electron micrograph showing a thin section (80 nm) of a RBL-2H3 mast cell. Organelles are marked as follows: nu, nucleus; er, endoplasmic reticulum; m, mitochondria; sv, secretory vesicles. Arrows point to ER-mitochondrial junctions. Note that only a few examples of ER, mitochondria and ER-mitochondrial junctions are marked. B, simultaneous confocal imaging of IP3R-driven [Ca2+]c and [Ca2+]m signals in RBL-2H3 cells. Cells were loaded first with rhod-2 AM ([Ca2+]m; 3 μm for 50 min at 37 °C) and subsequently with fluo-3 AM ([Ca2+]c; 5 μm for 25 min at room temperature). Evidence that rhod-2 measured [Ca2+]m in RBL-2H3 cells was provided by morphological and pharmacological studies described in Csordás et al. 1999. Fluorescence intensity of fluo-3 and rhod-2 reflecting [Ca2+]c and [Ca2+]m are depicted on linear green and red scales, respectively. Confocal image time series shows the spatiotemporal pattern of [Ca2+] responses evoked by a phospholipase C-linked adenosine receptor agonist, 5′-(N-ethyl)carboxamidoadenosine (NECA, 50 μm). Graphs show corresponding traces of [Ca2+]c and [Ca2+]m (fluo-3 and rhod-2 signals, respectively, expressed as fluorescence arbitrary units) calculated for the regions marked by boxes on image i.