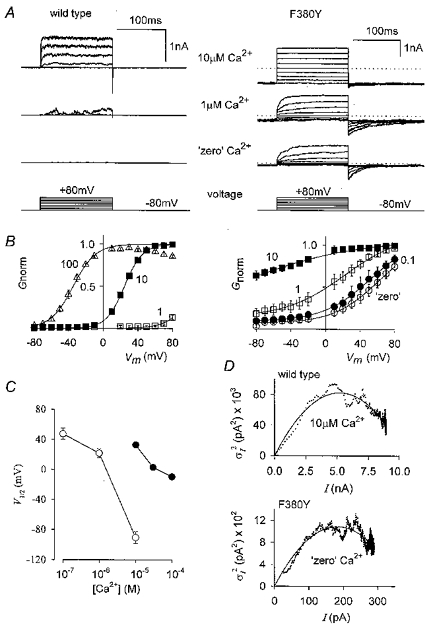
Figure 3. The voltage and Ca2+ sensitivity of wild-type and F380Y hSloα channels are different.

A, representative current families (individual records) from wild-type and F380Y channels, as indicated, recorded from inside-out macropatches. Voltage steps are from -80 to +80 mV in 20 mV increments and the internal [Ca2+] is as indicated. Steady-state activation curves were obtained by converting ensemble (10 at each voltage) currents to conductance and fitting with a Boltzmann relation. Conductances of individual patches were normalized (Gnorm) to the maximum conductance returned by the fit as described in the Methods and the plots for wild-type and F380Y channels are shown in B. The internal [Ca2+] (μm) is as indicated next to each curve. A comparison of these plots shows that F380Y channels require much less Ca2+ to be active and are less voltage dependent than wild-type hSloα channels. C, plot of V1/2 values from the Boltzmann relations of B against [Ca2+] for wild-type (•) and F380Y channels (○). D, mean- variance plots for wild-type (10 μm Ca2+) and F380Y (‘zero’ Ca2+) following pulses (83 for wild-type and 100 for F380Y) from -80 to +80 mV. The continuous lines show fits of these data to σ2=iI – I2/N, where i = single channel current, I = total current and N = number of channels. For wild-type i = 31.9 pA and N = 329 corresponding to a maximum Popen of 0.861, and for F380Y i = 11.9 pA and N = 31, corresponding to a maximum Popen of 0.796. The data of F380Y do not begin at zero because of the steady-state activity present at -80 mV.
