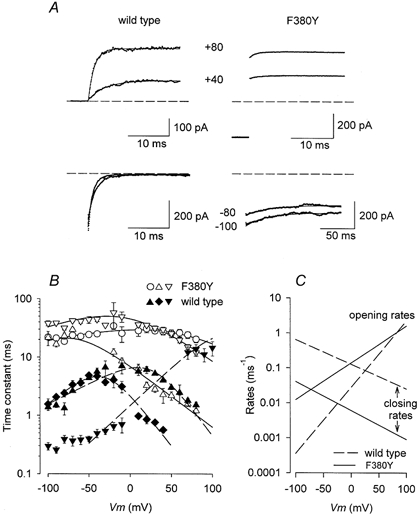
Figure 4. F380Y alters relaxation time course.

A, currents (dotted trace) from wild-type and F380Y channels recorded at the potentials indicated and fitted (smooth lines) with an exponential function. The time course at negative potentials is much slower for F380Y than for wild-type currents (note difference in time scale). The dashed lines represent zero current. B, plots of the relaxation time constants (mean ±s.e.m.) measured at various potentials and [Ca2+] for both wild-type (filled symbols) and F380Y (open symbols) currents. ○, 0 Ca2+; ▾, ▿, 1 μm Ca2+; ▴, ▵, 10 μm Ca2+; ♦, 100 μm Ca2+. The lines show the results of simultaneously fitting these data and those of the steady-state activation to eqns (2) and (3) as described in the text. C, plot of the opening and closing rate constants (ko and kc) as indicated for wild-type and F380Y channels in 10 μm Ca2+.
