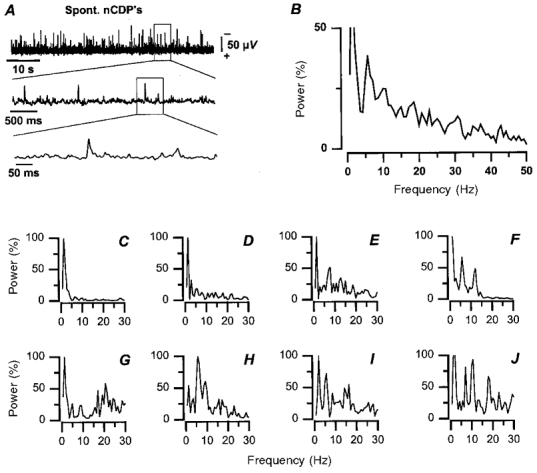
Figure 1. Power spectra of the spontaneous cord dorsum potentials.

A, recordings of spinal cord dorsum potential at the L6 segmental level with different time bases, as indicated. Negativity upward. B, power spectrum obtained by averaging the power spectra of the 8 experiments illustrated in C-J. Abscissa, frequency. Ordinates, power as percentage of the maximum attained in each experiment (100 %). Power spectra computed from continuous recordings lasting 1.5 min.
