
Figure 1. Volume-activated currents in SiHa cervical cancer cells.
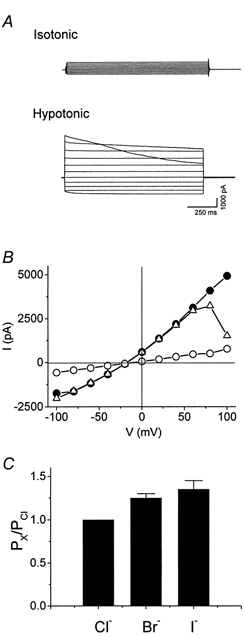
A, current traces (step protocol) were recorded in isotonic and hypotonic solutions. Horizontal lines either side of the traces represent the zero current level. B, current-voltage relationships obtained from traces in A. • and ▵, hypotonicity-induced current at the beginning and end of the voltage pulse, respectively; ^, current in isotonic solution. C, anion permeability of volume-activated currents. The anion permeability relative to that of Cl− (PX/PCl) was calculated from the shift in reversal potential as described in Methods. Each bar represents the mean ±s.e.m. (n = 5).