
Figure 3. Amplitudes of illusory movements evoked when the skin stretch was applied over the dorsal aspect of the hand and the dorsal and ventral sides of the MCP joint of digit IV in one subject.
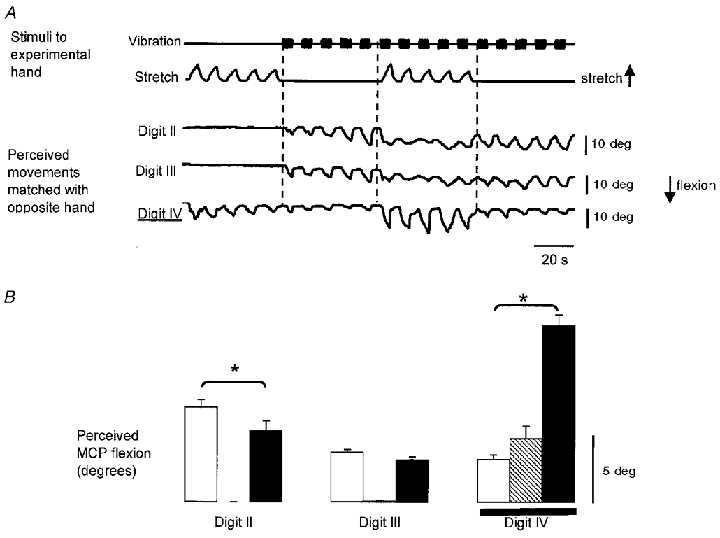
A, raw data from a single subject when the skin was stretched on the dorsal side of the hand and compressed on the ventral side of the MCP joint at digit IV. The top two traces show the time course of the application of the vibration and the skin stretch. The bottom three traces show the resulting illusory movements at the MCP joints as indicated by the voluntary movements of the matching hand. Flexion at the MCP joint is shown as a downward deflection. The digit at which the skin stimulation was applied is indicated with the double underline. B, mean amplitude (±s.e.m.) of the illusory movements from all cycles of each type of stimulation from the data shown in A (n = 10 for each mean). Data shown for vibration only (open bars), skin stretch only (hatched bars), and vibration combined with skin stretch (filled bars). The skin stimulation was applied at digit IV as indicated by the horizontal line. *Significant differences.