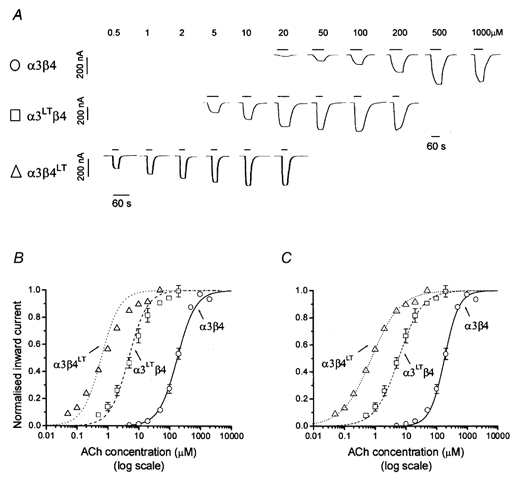
Figure 4. Agonist sensitivity of ‘pair’α3β4 nicotinic receptors containing 9′ Thr mutations in α3 or β4.

A, examples of inward currents elicited by bath-applied ACh in oocytes expressing α3β4, α3LTβ4 or α3β4LT. B and C show ACh concentration-response curves pooled from experiments such as the ones shown in A (n = 4-7 oocytes): each response was normalised to the maximum current evoked by ACh in that oocyte (see Methods). Pooled normalised results were fitted with the Hill equation either as free fit (C) or under the constraint of equal slopes (B) in order to estimate the horizontal distance between the curves as a dose ratio (see Table 1). The concentration-response curves refer to oocytes injected with α3β4 (○), α3LTβ4 (□) or α3β4LT (▵). Note that the greater increase in ACh sensitivity was produced by mutating β4.
