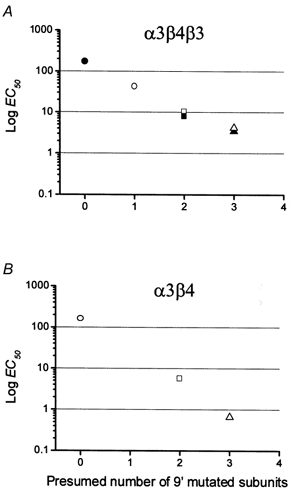
Figure 5. Relation between the ACh EC50 of the different combinations and their putative number of 9′ Thr mutations.

EC50 values are plotted on a log scale against the number of mutant subunits in each combination. This number was calculated on the basis of a subunit stoichiometry of 2:2:1 for the triplet α3β4β3 (A) and 2:3 for the pair α3β4 (B). Symbols as in Figs 2–4. Note the approximate linearity of the decline in EC50 for both types of receptor.
