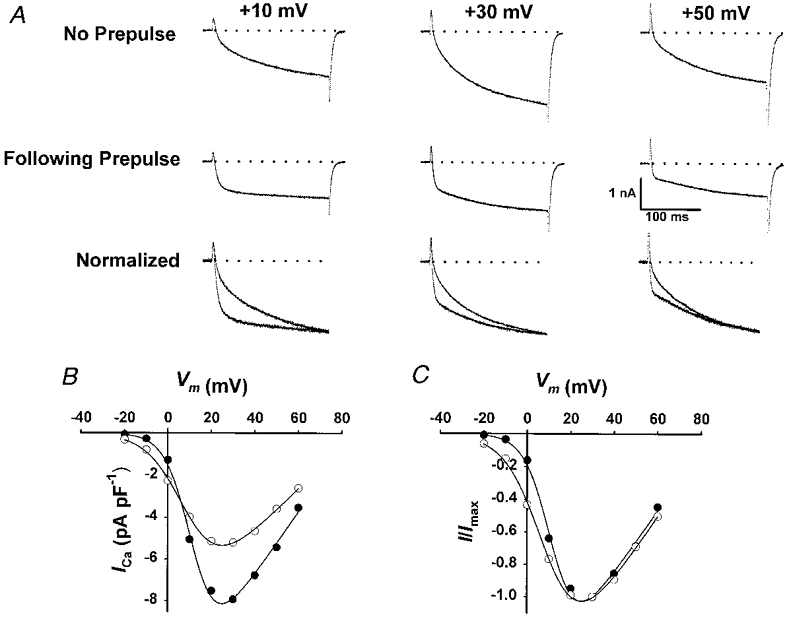
Figure 6. Acceleration of L-channel activation kinetics is voltage dependent.

A, data obtained for test pulses to +10, +30 and +50 mV are shown in the absence of a prepulse (top row), following brief recovery from prolonged depolarization (60 s +40 mV/10 s -80 mV, middle row), and after normalization to the control current recorded at +30 mV (bottom row). Tail currents have been truncated for clarity. B, peak I–V relationships of control and accelerated L-currents obtained from the experiment shown in A. Fitting the I–V data for multiple experiments to eqn (1) yielded the following average values (n = 6): for control, Gmax = 221 ± 13 nS nF−1, VG1/2 = 14.0 ± 1.0 mV and kG = 5.7 ± 0.2 mV; for 10 s repriming, Gmax = 140 ± 16 nS nF−1 (P < 0.01), VG1/2 = 12.3 ± 0.8 mV and kG = 8.1 ± 0.3 mV (P < 0.001). C, I–V curves shown in B normalized to the peak current value recorded in the absence of prolonged depolarization.
