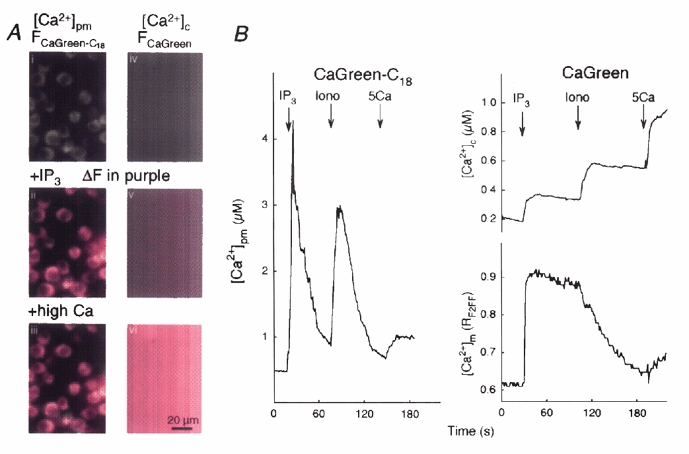
Figure 3. Changes of perimembrane and global [Ca2+]c during Ca2+ mobilization.

A, i and iv, grey-scale images show the fluorescence of Calcium Green-C18 attached to permeabilized RBL-2H3 mast cells (left) and Calcium Green added to the medium (right). Increases of the fluorescence (ΔF) evoked by IP3-induced Ca2+ release (ii and v) and a saturating dose of CaCl2 (1.5 mm, high calcium, iii and vi) are shown in purple. B, time course of the [Ca2+]pm responses evoked by IP3 (12.5 μm), ionomycin (Iono, 10 μm) and Ca2+ (5 μm, 5Ca) are shown on the left. Time courses of [Ca2+]c recorded simultaneously with [Ca2+]m are shown on the right.
