
Figure 5. Quantification of Ca2+ redistribution between intracellular Ca2+ stores during Ca2+ mobilization.
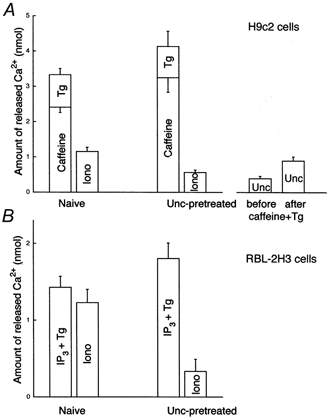
Amounts of Ca2+ released upon addition of caffeine (20 mm), Tg (2 μm) or IP3+ Tg (12.5 μm IP3, 2 μm Tg), and ionomycin (Iono,10 μm) in naive and uncoupler (Unc, FCCP + oligomycin)-pretreated H9c2 myotubes (A) and RBL-2H3 mast cells (B).