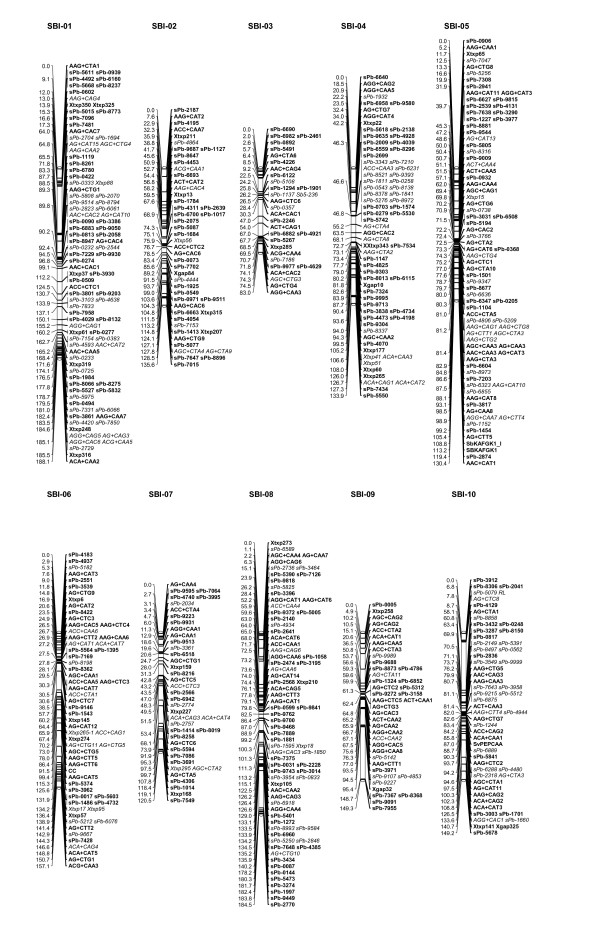
Figure 2.
Genetic linkage map for a cross between R31945-2-2 and IS 8525. Genetic distances are expressed as cumulative map distances from position 0.0 (first locus of LG) in cM (Kosambi estimates). Locus names in bold indicate framework markers; locus names in italics indicate attached and delegate markers.

