Figure 8.
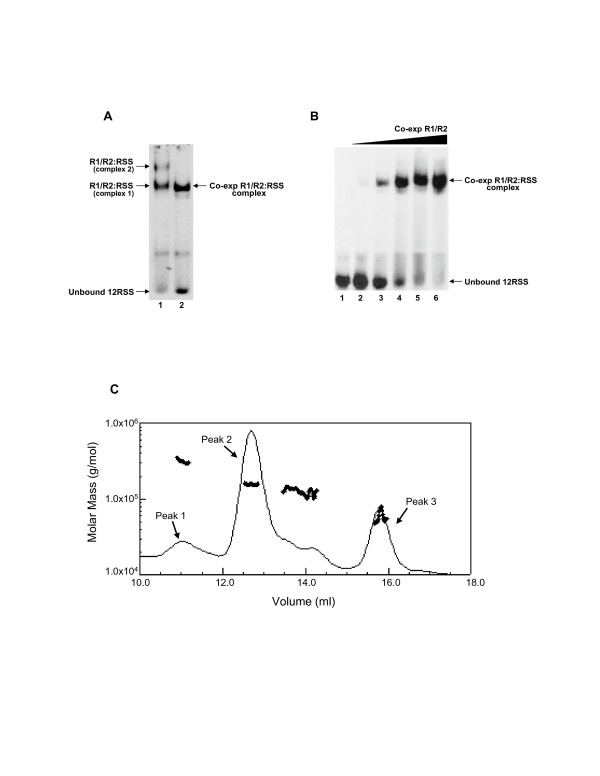
Co-expressed R1 and R2 form a single complex with the 12-RSS. (A) EMSA comparing complex formation of separately-expressed versus co-expressed (in 293T cells) of MCR1 and GST-core RAG2 with the 12-RSS. Lane 1 consists of the separately-expressed proteins and is analogous to lane 3 in Figure 7A. Lane 2 consists of co-expressed R1 and R2 proteins (at concentrations of 4 nM R1 and 2 nM R2). The protein-DNA complex in lane 2 coincides in migration position to complex 1 in lane 1. (B) Titration of increasing concentrations of co-expressed R1 and R2 proteins to the 12-RSS. The R1/R2 complex concentration (in terms of R1 concentration) varied from 1.7 nM in lane 2 to 28 nM in lane 6. (C) A representative molar mass distribution plot of GST-core RAG2 obtained from MALLS-SEC analysis. The molar masses for sample eluting in the retained peaks are shown as filled circles. The molar mass is shown on the y-axis in log scale. Experimental masses for protein eluting in Peaks 1 and 2 were at 314 kDa and 156 kDa, respectively, most consistent with tetrameric and dimeric GST-core RAG2 (predicted monomer molar mass at 68.9 kDa). The shoulder on Peak 2 consisted of protein that eluted with a molar mass of 127 kDa, and material eluting in Peak 3 was determined to be at a molar mass of 59 kDa.

