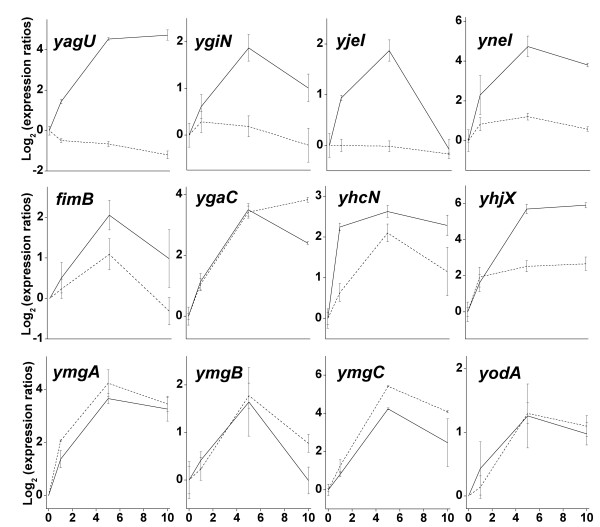
Figure 2.
Real-Time PCR expression ratios of selected genes. Bacteria were cultured and real-time PCR was conducted as described in Materials and Methods. For each experimental condition, the 1, 5, and 10 min expression values were normalized to time 0. For each gene, log2 (expression ratios) are shown for amplified message after the rapid addition of either HCl (15 mM, solid line) or sodium benzoate (30 mM, dotted line).

