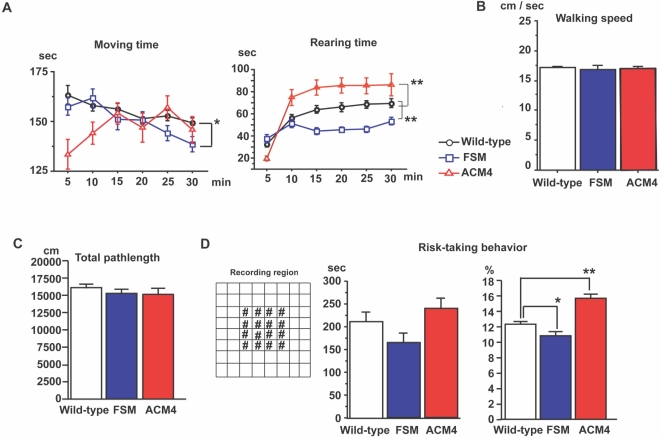
Figure 2. Activin protein levels in the brain influence locomotor activity.
(A) Statistical analyses of the open field test showing time spent in locomotion and rearing [wild-type littermates (black circles), n = 34; FSM (blue squares), n = 18; ACM4 (red triangles), n = 11]. Each plot represents an average of 5 minutes. *, p<0.05; **, p<0.001; Fisher's test. (B and C) Statistical analyses of walking velocity (B) and total pathlength (C) during 30 minutes of open field test. (D) Risk taking behavior test. Left panel, overhead view of the box used for open field test. #, area defined as a center region. Mid panel, time spent in the center region during the 30 minutes of open field testing. Right panel, the percentage pathlength in the center region. Results are shown as mean±s. e. m.

