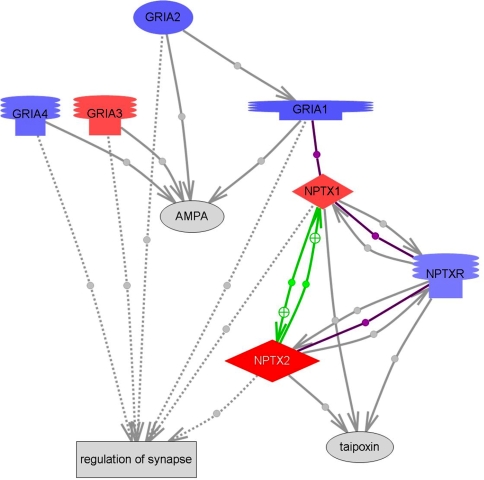
Fig. 4.
NPTX2 pathway obtained by means of the Resnet 5.0 eukaryotic database of molecular interactions (Ariadne) overlayed with microarray expression values. Changes of PD relative to normal are indicated in red (increased in PD) and blue (downregulated), respectively. Abbreviations: AMPA alpha-amino-3-hydroxy-5-methyl-4-isoxazolepropionic acid; GRIA1 glutamate receptor, ionotropic, AMPA 1; GRIA2 glutamate receptor, ionotropic, AMPA 2; GRIA3 glutamate receptor, ionotrophic, AMPA 3; GRIA4 glutamate receptor, ionotrophic, AMPA 4; NPTX1 neuronal pentraxin I; NPTX2 neuronal pentraxin II; NPTXR neuronal pentraxin receptor. Green line, regulation; purple line, binding. The dotted grey lines connect to a cell process whereas the solid lines connect to a molecule. The grey colour indicates that the effect and/or mechanism are unknown. References for all protein interactions shown are provided in the Electronic Supplement to this figure

