
Figure 2.
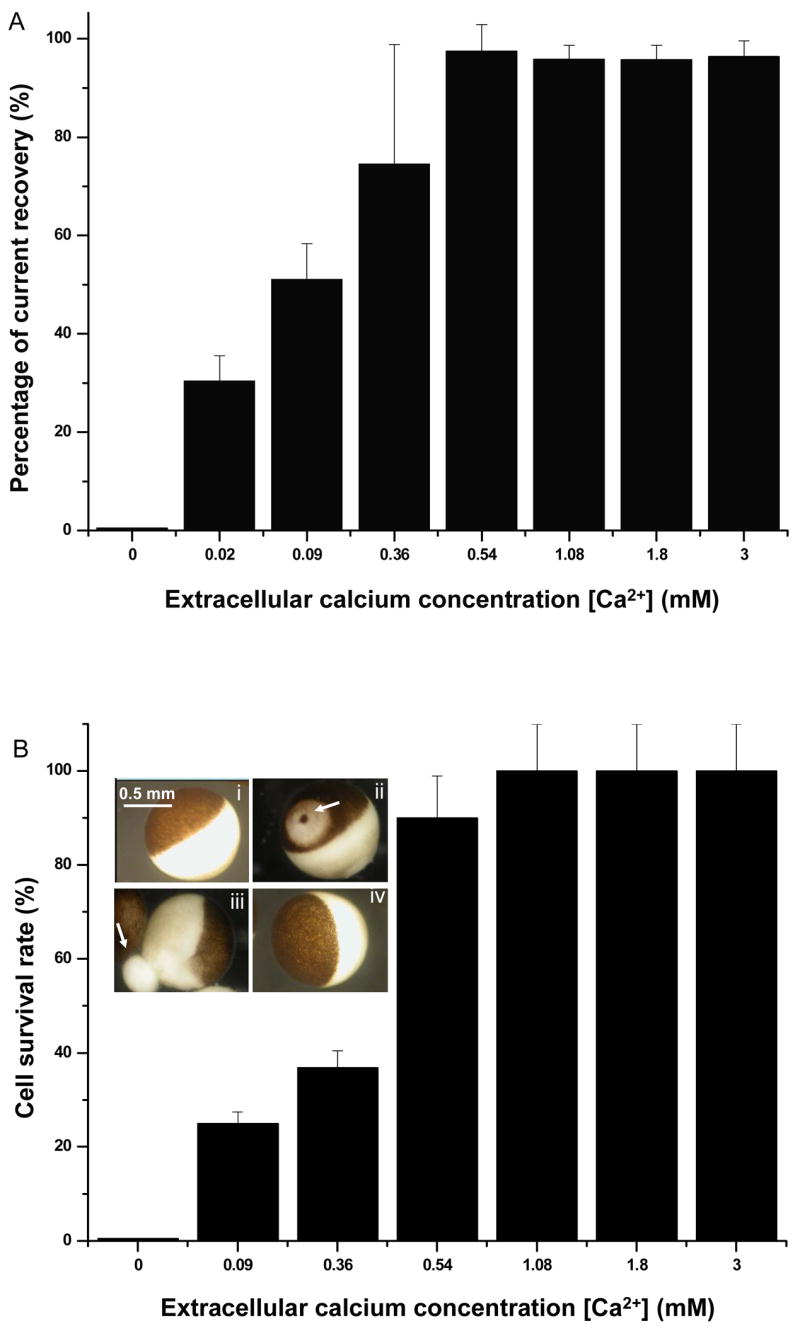
Cell resealing and survival at different extracellular [Ca2+]. A) Percentage of the transmembrane current recovery from the maximum value in the presence of 0.02, 0.09, 0.36, 0.54, 1.08, 1.8, and 3.0 mM extracellular [Ca2+] with n=13, 10, 19, 10, 12, 20, and 11, respectively. B) Percentage of survived cells at extracellular [Ca2+] of 0, 0.09, 0.36, 0.54, 1.08, 1.80, and 3.0 mM with n=12, 8, 19, 19, 8, 21, and 11, respectively. Inset: Light micrograph images of Xenopus oocytes, showing a single oocyte before sonoporation (i), one oocyte with an un-sealed pore (arrow) where discoloration around the un-sealed pore is apparent (ii), a degenerating oocyte with leaking cytoplasmic contents (arrow) in the absence of Ca2+ (iii), and a recovered oocyte after sonoporation in the presence of 1.8 mM Ca2+ in solution (iv).