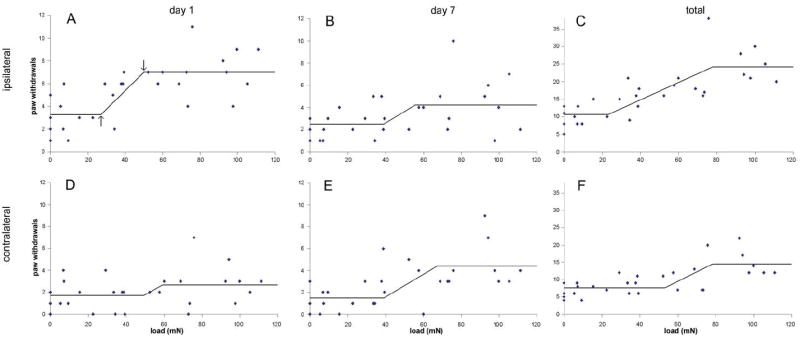
Figure 3.

Mechanical allodynia on days 1 (A, D) and 7 (B, E) after compression, and total allodynia (C, F) as a function of applied nerve root load magnitude. Ipsilateral (A-C) and contralateral (D-F) mechanical allodynia are shown for stimulation with a 39.2mN von Frey filament. Superimposed on each plot is the corresponding three-segment change point model with the segments having no difference from sham, a linear increase in allodynia with load, and the maximum allodynia responses. The first and second change points are indicated by arrows in panel (A).
