
Figure 6.
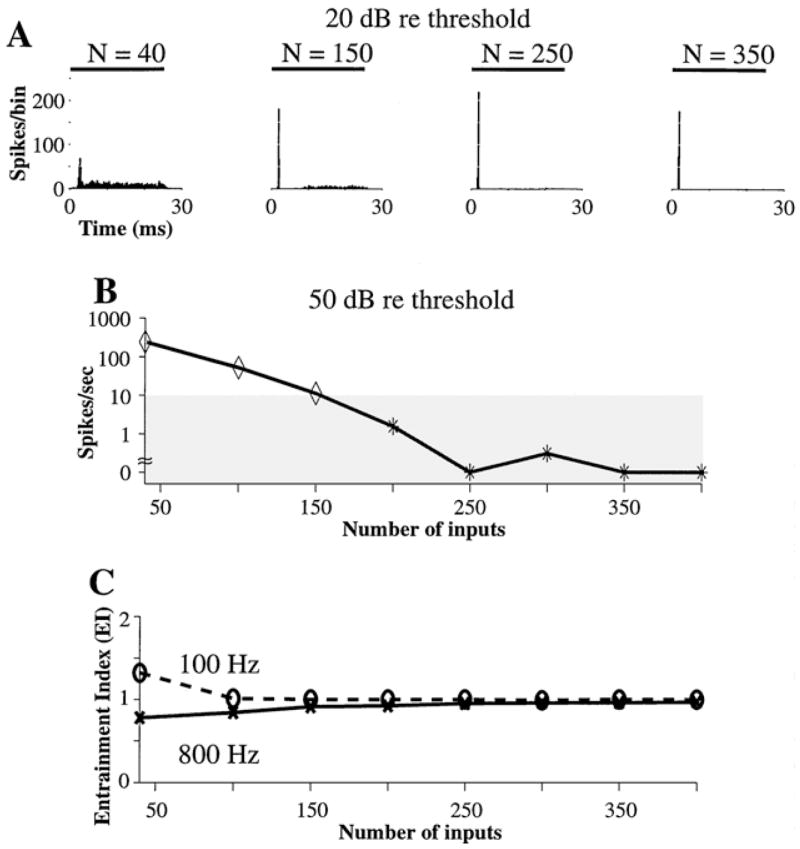
The effect of the number of inputs on PST histograms in the dynamic spike-blocking model. A: PST histograms of responses to 6000 Hz tone bursts presented at 20 dB above threshold for N equal to 40, 150, 250, and 350. The PST histograms for N equal to 40 and 150 are Sustained while those for N equal to 250 and 350 are On. B: Steady-state discharge rate versus N for tone bursts presented at 50 dB above threshold. The shaded area is the range for On-I neurons. Vt = 0.4, N · Gα = 10. (Note: abscissa in B starts at N = 40).