
Figure 8.
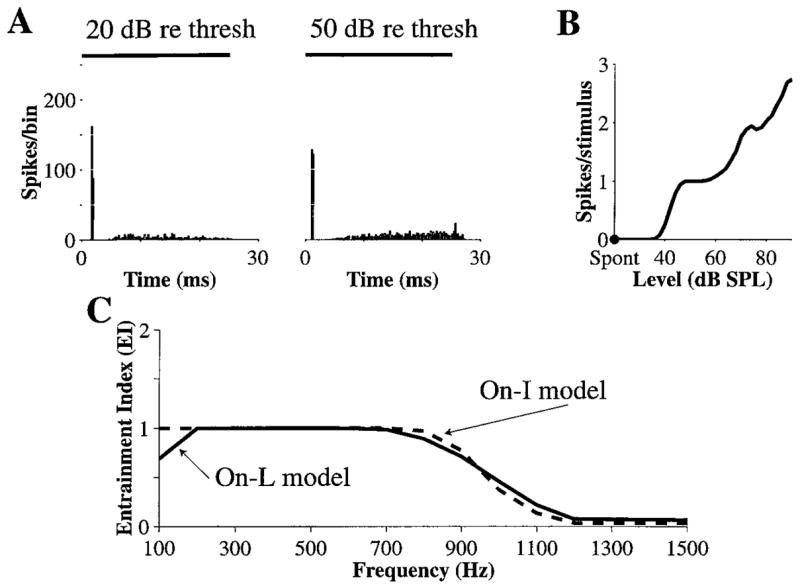
On-L discharge patterns produced by the dynamic spike-blocking model, with N · Gα = 8.8. A: PST histograms for 6000 Hz tone bursts presented at 20 dB and 50 dB above threshold. B: Average discharge rate versus level of 6000 Hz tone bursts. C: EI versus frequency for the On-L model (solid). The curve for the On-I model (dashed) from Fig. 3C is also shown for comparison. N = 400.