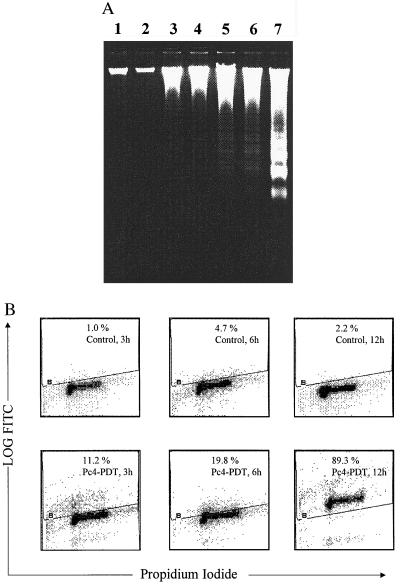
Figure 1.
Induction of apoptosis by PDT. (A) DNA ladder formation by PDT in A431 cells. The cells were treated with Pc4 only, light only or Pc4+light. After designated times, the cells were harvested, cellular DNA isolated and subjected to agarose gel electrophoresis followed by visualization of bands as described in Materials and Methods. The data shown here are from a representative experiment repeated three times with similar results. Lane 1, untreated control; lane 2, Pc4 only; lane 3, light only; lane 4, Pc4+light (1 hr post-PDT); lane 5, Pc4+light (3 hr post-PDT); lane 6, Pc4+light (6 hr post-PDT); lane 7, Pc4+light (12 hr post-PDT). (B) Quantification of apoptosis by flow cytometry. The untreated control cells or PDT treated cells were harvested after designated times, labeled with deoxyuridine triphosphate using terminal deoxynucleotide transferase and propidium iodide, and analyzed by flow cytometry. The results are displayed using dual parameter method where the x and y axes represent DNA and deoxyuridine triphosphate fluorescence respectively. The cells displaying deoxyuridine triphosphate fluorescence above that of the control population, as indicated by the line in each histogram are considered as apoptotic cells and their percent population is shown at right top in each box. Similar data were obtained in two repeat experiments.

