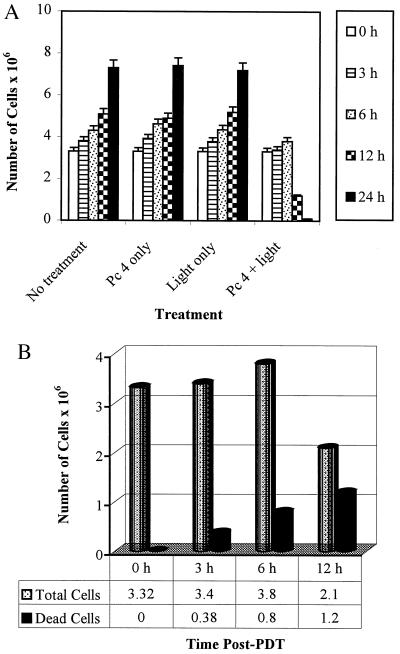
Figure 2.
Effect of PDT on cell growth and viability. (A) Growth of A431 cells after PDT. The cells were subjected to PDT and harvested at designated times post-PDT and the total number of cells was counted. The data shown are means ± SEM of three independent experiments, each run in triplicate. (B) Viability of A431 cells after PDT. The cells were treated as above and the number of viable cells was counted using trypan blue exclusion assay. The cell viability is represented as number of viable cells × 106. The data shown are representative of three independent experiments, each run in triplicate. The variation between the experiments is <5%.

