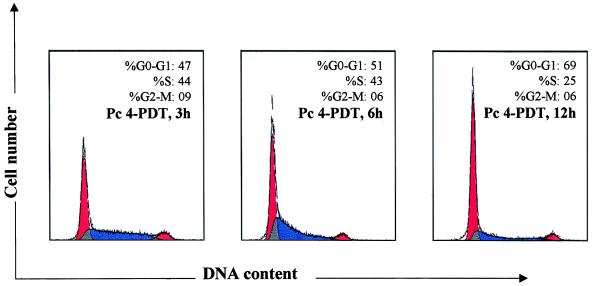
Figure 3.
DNA flow cytometric analysis. The A431cells were treated with Pc4+light and harvested for designated times as shown in the figure and described under Materials and Methods, and analyzed by flow cytometry. The appropriate controls were also incorporated. The percentage of cells in G0-G1, S, and G2-M phase were calculated using cellfit computer software and are represented within the histograms. The data shown here is from a representative experiment repeated four times with similar results. Because the G0-G1 cell population of controls did not show any significant change and ranged between 39% and 43%, the data are not supplied.

