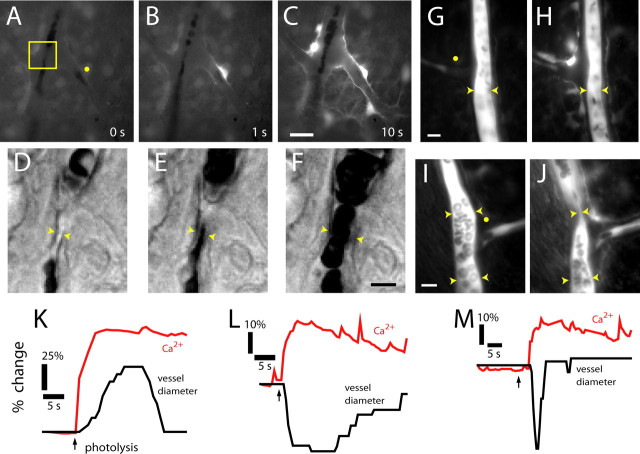
Figure 4.
Photolysis of caged Ca2+ in glial cells evokes vasodilation and vasoconstriction. A–C, Fluorescence images showing a Ca2+ increase that propagates through several glial cells after an uncaging flash. D–F, Glial-evoked vasodilation. IR-DIC images of the region indicated in A are shown, each acquired 0.5 s after the corresponding image above. G, H, Glial-evoked vasoconstriction. Fluorescence images of a fluorescein-filled vessel before and after photolysis. Note the photolysis-evoked increase in glial Ca2+. I, J, Glial-evoked sphincter-like vasoconstriction. Fluorescence images of a fluorescein-filled vessel before and after photolysis. Yellow dots in A, G, and I indicate sites of uncaging flash. Scale bars: C, 20 μm; F, 5 μm; G, 10 μm; I, 10 μm. K–M, Time course of glial Ca2+ change and vessel dilation (K), constriction (L), and sphincter-like constriction (M).

