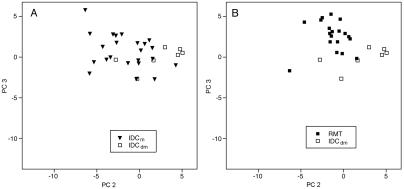
Figure 4.
PC plots comparing spectra of human breast DNAs from (A) metastasized primary adenocarcinoma (IDCm) and IDC metastases to axillary nodes (IDCm); and (B) morphologically normal reduction mammoplasty tissue (RMT) and IDCdm. See text and Table 1 for statistical comparisons of order–disorder status between groups.

