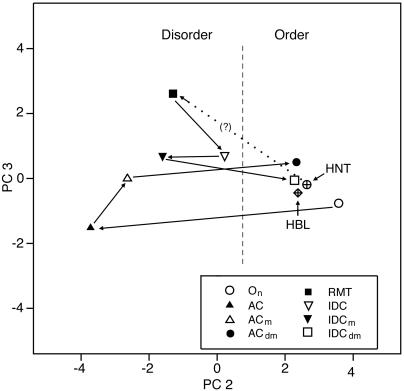
Figure 5.
Tumor progression pathways are depicted in a PC plot of human ovarian and breast DNA centroids (derived from groups of spectra). The centroid representing the DNAs of hypothetically normal tissue (HNT) and human blood leukocytes (HBL) also are included (see text for details). The dashed vertical line broadly distinguishes the centroids of the relatively ordered and disordered groups.

