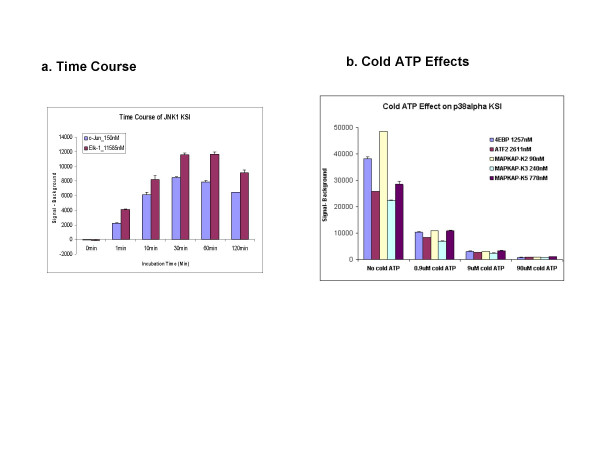
Figure 4.
Effect of time and ATP concentration on assay performance. (a)Time course of phosphorylation observed for two substrates of JNK1 kinase. The net P33 signals were plotted. (b) Different amounts of non radioactive ATP (cATP) were added to the reaction mixture and compared to assays with a constant amount of radioactive ATP (γ33P-ATP). The P33 signals (average from two slides) of different substrates are compared for different amounts of cATP.

