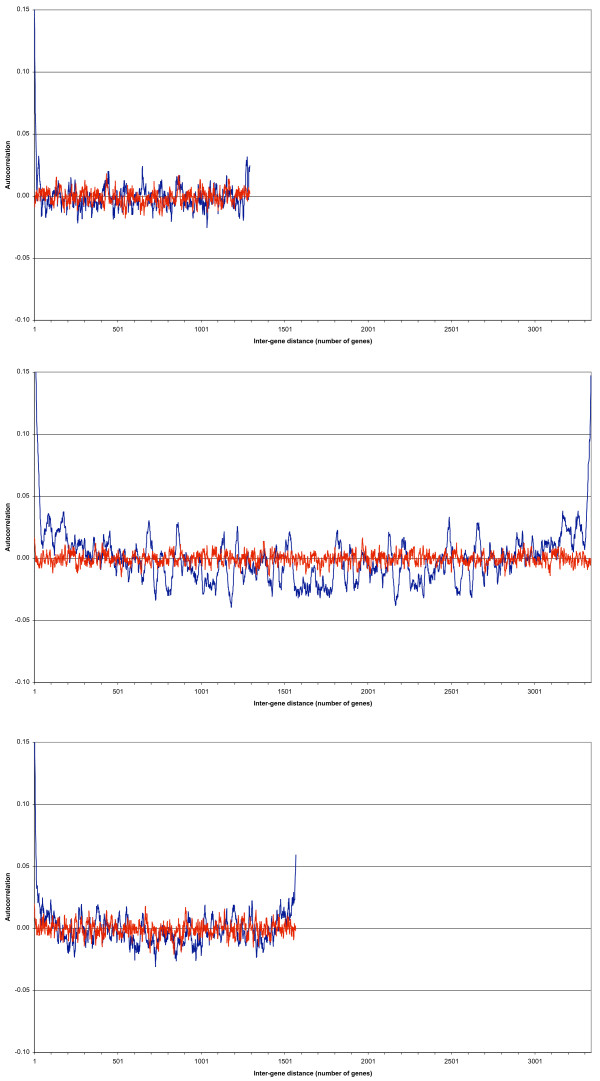
Figure 2.
a, b and c – The autocorrelation functions for data set B, when pSymA is transcribed stochastically only. Figure 2a shows the autocorrelation function for the megaplasmid pSymA (blue curve) when only stochastic transcription takes place (data set B). The red curve shows the autocorrelation function when the genes' positions were randomly assigned. The Y-axis has been cropped at an autocorrelation of 0.15 for a clearer visual interpretation; the blue curve starts at an autocorrelation of 0.15 for a gene distance of one. The signal becomes quickly confounded with the noise (red curve). There are minima and maxima that stand out, but only a spectral analysis can tell, whether these are significant or not. Again to serve as comparison, Figures 2b and 2c show the autocorrelation functions for the chromosome and the megaplasmid psymB, respectively, for data set B. Both replicons are actively transcribed and translated, unlike psymA, and their autocorrelation functions are comparable to those in data set A (as confirmed by the spectral and statistical analyses, see additional file 1). Note: The figures are all at the same scale to better illustrate the different sizes of the three replicons. All Y-axes have been cropped at a value of 0.15 for (visual) clarity's sake.

