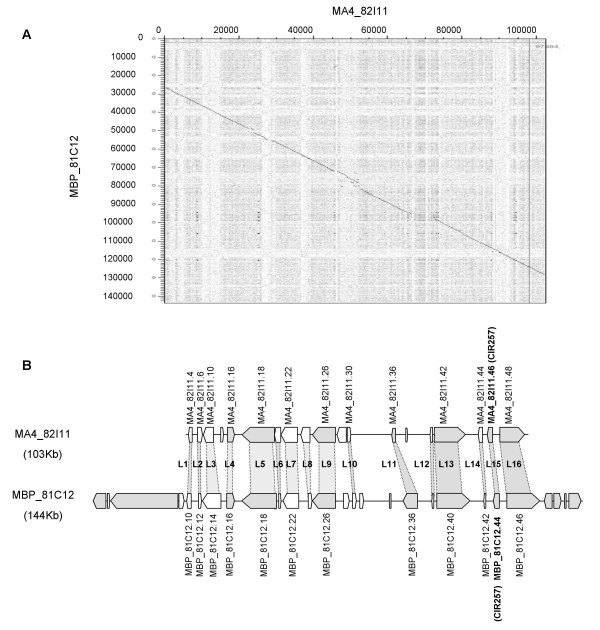
Figure 7.
Comparison between M. acuminata MA4_82I11 BAC clone and M. balbisiana MBP_81C12 BAC clone. Predicted genes and their orientation are shown as boxed areas. Genes annotated such as hypothetical genes are represented in white. The probe used to identify the Musa BAC clones is indicated in brackets. Conserved genes between the two Musa regions are connected by shaded areas. (A) Dot plot analysis of the two pairs of homeologous BACs from M. acuminata and M. balbisiana.(B) Diagram of the syntenic regions between the two BAC clones.

