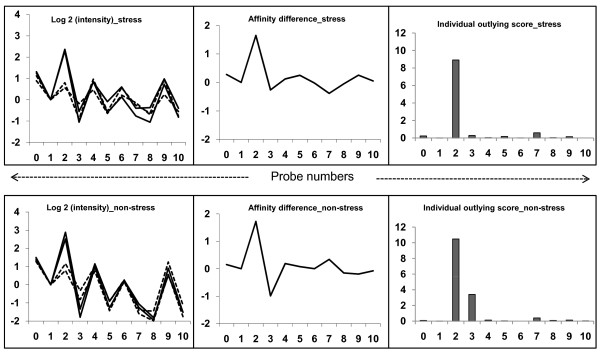
Figure 2.
Plots of signal intensities, affinity differences and individual outlying scores. Left panels: log intensities (PM, perfect match) for a representative probe set (Gma.1863.1.S1_at) from two genotypes. Middle panels: the differences of average log intensities between two genotypes. Right panel: individual outlying scores for each probe. Dotted lines indicate IT93K-503-1 and solid lines indicate CB46. This SFP was identified both in stress (upper layer) and non-stress (lower layer) datasets.

