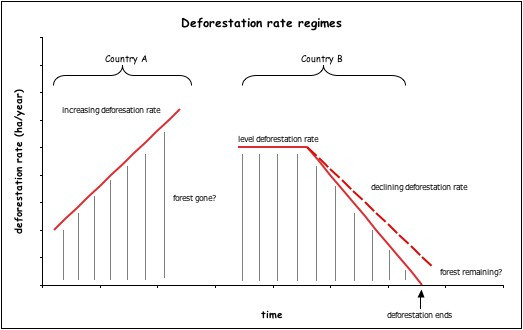
Figure 1.

Preservation Pathways Schematic. Deforestation rate regime schematic showing examples with two different theoretical countries. Example country A exhibits an increasing deforestation rate with accelerating near-term loss of original forest. Example country B exhibits a constant, then declining deforestation rate with the possibility of preserving a portion of original forest.
