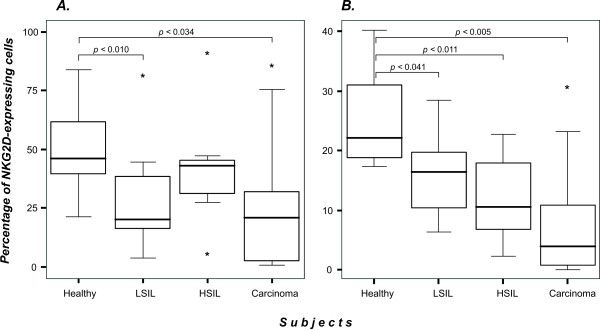
Figure 2.
NKG2D-expressing immune cells are decreased in patients with cervical cancer and precursor lesions. Three color flow cytometry analysis to detect CD3, CD56 and NKG2D was carried out on PBMC to determine the percentage of NKG2D-positive cells. A) NKG2D-expressing NK cells (CD56+CD3- population); B) NKG2D-expressing T cells (CD56-CD3+ population). The box plots represent each study group. Medians are represented as thick horizontal lines, 25th and 75th percentiles as boxes and 10th and 90th percentiles as whiskers. *Extreme values.

