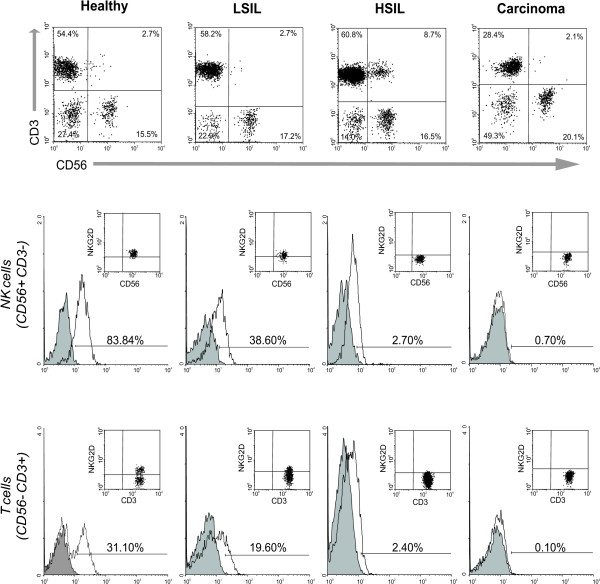
Figure 4.
The number of NKG2D-expressing NK and T cells diminishes during cervical cancer progression. NKG2D expression was measured using flow cytometry while gating on CD56+CD3- (NK cell) and CD56-CD3+ (T cell) populations. The histograms and dot plots show the results obtained from a representative individual of each group. The same tendency is observed in both NK and T cells (filled curve: isotype control Ab, open curve: anti-NKG2D).

