

Abstract
Children with Developmental Coordination Disorder (DCD) are reported to have high temporal variability in tasks requiring precise timing. The current study examined whether this timing deficit was due to the cerebellar ‘explicit timing’ process in the discontinuous, but not the continuous movement. Ten children with DCD and thirty-one typically developing children performed continuous, discontinuous circle- and line-drawing tasks. Results showed that both children with DCD and their age-matched controls had higher temporal variability in the discontinuous than that in the continuous movements. Individual comparisons between each child with DCD and the performance of typically developing children revealed that two out of ten children with DCD showed limited timing deficit in both types of discontinuous drawing (lines and circles). Additionally, three different children with DCD had timing problems with only discontinuous line drawing. Thus, the possibility of a compromised cerebellar function may exist in a subgroup of children with DCD. This work raises a critical issue with respect to the functional heterogeneity of this population and emphasizes the importance of an individualized analysis in this movement disorder.
Keywords: Developmental Coordination Disorder (DCD), timing, circle drawing, cerebellum
One of the most salient features of coordinated movements is the temporal consistency across repetitions. Children with Developmental Coordination Disorder (DCD)[1] have demonstrated much higher temporal variability than age-matched typically developing children in tasks that require precise timing[6;13;22]. While up to 6% of American school children are thought to be affected by DCD[1], the underlying mechanism and its etiology are still not well understood.
One hypothesis that has recently emerged is that the poor timing in children with developmental disorders may be attributed to impaired cerebellar function[10;15]. A few studies indicate that children who were classified as ‘clumsy’ had difficulties in fine motor tasks requiring precise timing, similar to that observed in adult patients with cerebellar lesions[6;13;22]. Recently, it was reported that patients with cerebellar lesions have restricted timing deficits in discontinuous but not in continuous circle drawing tasks[11;18;24]. This is thought to reflect the ‘explicit timing’ processes, in the sense that a temporal goal is explicitly represented, which requires the integrity of the cerebellum for control of discontinuous movements. In contrast, the emergent properties of the movement trajectory during continuous movements would build on ‘implicit timing’ processes that do not involve the cerebellum. While a number of studies have addressed these “explicit” versus “implicit” timing processes in adults, far less attention has been drawn to examine temporal consistency of children with and without DCD performing drawing movements, tasks that are closely related to school activities such as handwriting.
Drawing and writing difficulties are the most common problems in children with DCD[14;17]. It has been argued that such difficulties are due to a higher level neuromotor noise in the limb system[17]. Volman and Geuze [19] have shown that less stable coordination in children with DCD is due to a deficit in dynamic movement control. Young children (2th grade) have more difficulties in performing discontinuous loops than continuous loops[21]. Will the ‘dynamics’ also play a role in temporal consistency in children with DCD? Drawing discontinuous circles requires the more frequent turning on and off of certain muscle groups, which is dynamically more challenging compared to continuous circle drawing. It is very possible that the poor temporal consistency may be related to both the “explicit timing” and “dynamic control” processes. Unfortunately, our knowledge of how children with DCD perform continuous versus discontinuous drawing movements is very limited. Thus, this study investigated 1) whether children with DCD showed restricted timing deficits in discontinuous circle drawing similar to those reported in patients with cerebellar lesions, and 2) whether children with DCD had better temporal consistency when performing dynamically simpler continuous and discontinuous line drawing as compared to circle drawing. Experimentally, the dynamic complexity was manipulated by changing the number of joints involved; while the line drawing task involved predominantly single-joint elbow movements, and the circle drawing involved elbow and shoulder movements. The temporal demands were manipulated by asking participants to perform the drawing task continuously or discontinuously, with the discontinuous movements requiring more ‘explicit’ temporal control.
Ten children diagnosed with DCD (mean age 9.03 ± 1.4), and thirty-one children across a range of ages (from 5 to 11 years, mean age 8.62 ± 1.5) who were typically developing from the area surrounding a suburban university community were recruited as subjects. Ten out of these thirty-one children who were gender- and age-matched within ± 3 months constituted the control group. Prior to the experiment, all participants were screened using the following inclusion and exclusion criteria. Children with DCD were included when they 1) scored below the 5th percentile in the Movement Assessment Battery for Children (MABC)[9]; 2) tested normal cognitive ability as assessed by the Woodcock-Johnson Revised Cognitive Ability Early Development Scale[23]; and, 3) had an independent DCD diagnosis from a pediatrician specializing in movement disorders. We used the 5th percentile MABC cutoff following the recommendation of Geuze and colleagues[5] for the cut-off level for research studies on children with DCD. The exclusion criteria for the typically developing children were: 1) a standardized Beery–Buktenica Developmental Test of Visual-Motor Integration (VMI, 4th edition)[2] score lower than 1½ standard deviations below the mean; and, 2) a MABC score lower than the 30th percentile. The 30th percentile cutoff for our control group was chosen in order to exclude potential ‘borderline’ cases on the functional continuum children display. Note that because most of the children with DCD had writing problems, we did not use the VMI as inclusion criteria for DCD group although all participants were tested with the VMI. Childrens’ parents or legal guardians were fully informed of the task purpose, and signed the consent forms prior to the child’s participation in the study. All procedures were approved by the Institutional Review Board of the University of Maryland, College Park.
During the experiment, participants sat comfortably at a table with a digitizing tablet (WACOM InTuos™, Vancouver) in front of them and centered at the participant’s midline. A digitizing pen was taped to the back of the index finger of the dominant hand, the pen position thus representing the child’s finger movement. A paper template, either a circle (5 cm diameter) or a 45-degree slanted thin ellipse (7.1 cm in the long-axis and 0.2 cm in the short-axis, resembling an up-and-down line movement, without necessitating wrist movement), was placed at the center of the tablet. A thin ellipse was used instead of single line because it decreased young children’s confusion where to make pauses while the basic motion was still line drawing. We instructed participants to use the template as a guide rather than trying to accurately trace the templates, and emphasized temporal consistency rather than spatial accuracy throughout the tests.
Participants performed both the continuous and discontinuous circling, as well as the line drawing movements (detail instructions for each condition are listed in Table 1). At the beginning of a trial, a ‘phasing-in period’ was announced by the experimenter with the phrase ‘ready, go’ and the participants synchronized their movements with the metronome (Quikwatz™). Once the participant had become synchronized with the rhythm (approximately 10–15 beats) based on the experimenter’s observation, the metronome was turned off. All participants were asked to move as consistently as possible for 20 seconds until the experimenter said ‘stop’. The target duration (the time to complete one circle or one thin ellipse) was fixed at 550ms.
Table 1.
Four drawing conditions performed by participants. The temporal demands of explicit timing were lower in the continuous conditions compared to the discontinuous task. Dynamic complexity was varied by the number of joints involved; line drawing task requires elbow, circle drawing requires both elbow and shoulder. Participants wore a splint to keep the wrist and fingers rigid. The position of the elbow was supported so that the back-and-forth movements were controlled by the elbow motion.
| Conditions | Continuous | Discontinuous |
|---|---|---|
| Circle drawing | Subjects were instructed to make continuous counter-clockwise finger movements around a circle template and tried to arrive at the top of the circle with the metronome beat (i.e. 550ms each circle) | Subjects were instructed to make continuous counter-clockwise circling movements to a beat with each circle separated from the next one by a pause until the next metronome beat (i.e. 550 ms made a circle and 550ms pause) |
| Line drawing | Subjects were instructed to make continuous finger back-and-forth line motions and tried to arrive at the upper end of the template coincident with the beat of the metronome (i.e. 550ms each back-forth line) | Subjects were instructed to make back-and-forth drawing movements with each line separated from the next line by a pause until the next metronome beat (i.e. 550 ms made a back-and-forth drawing and 550ms pause). |
Five dependent measures were reported: Movement time (MT, sec) was the time taken for completion of one circle or one back-and-forth line. Movement Time Coefficient of Variation (CVMT, unit free) measured the temporal variability of the movements. Movement total distance (TD, mm) was the total movement length traveled by the pen for each individual segment, i.e., one circle or one back-and-forth line. Total Distance Coefficient of Variation (CVTD, unit free) measured the line length as a measure of spatial variability of the movements. Root mean square error (RMSE, in cm) assessed the average deviation between actual movement trajectory and the ideal trajectory.
Mixed model repeated-measures ANOVAs with group (DCD/controls) as a between-subjects factor, and condition (continuous/discontinuous; circles/lines) as a within-subjects factor were performed on the dependent measures. Post-hoc tests using LSD were employed to follow up any significant effects. In order to assess the individual performances of children with DCD relative to the typically developing children, we performed a mixed model linear regression analysis, with age being treated as a continuous variable in each condition. The 95% upper and lower confidence limits (UCL and LCL) on the individually predicted values were calculated to represent the 95% confidence intervals around the typically developing children’s performance. Individual data higher than the UCL would suggest that the variability was higher than the normal range at a 0.05 significance level.
The mean MT for each subject was shorter than 1s, which verified that both children with and without DCD were drawing within the ‘cerebellar’ timing range[8]. A repeated measure ANOVA revealed significant main effects for group (F(1,18)=7.86, P=0.012) and condition (F(3,54)=10.36, P<0.001). Post hoc analysis for the condition main effect showed that the mean MT for the discontinuous circling was on average 68ms longer than that for the continuous circling (F(1,54)=4.22, P=0.045). The mean difference for MT decreased by approximately 149ms (F(1,54)=20.27, P<0.001) from the discontinuous line drawing to the continuous line drawing (Fig. 1A). Group main effect revealed that the children with DCD moved 150ms slower than the age-matched controls on average. The mean movement time for controls was 540ms, which was very close to the target timing − 550ms.
Figure 1.
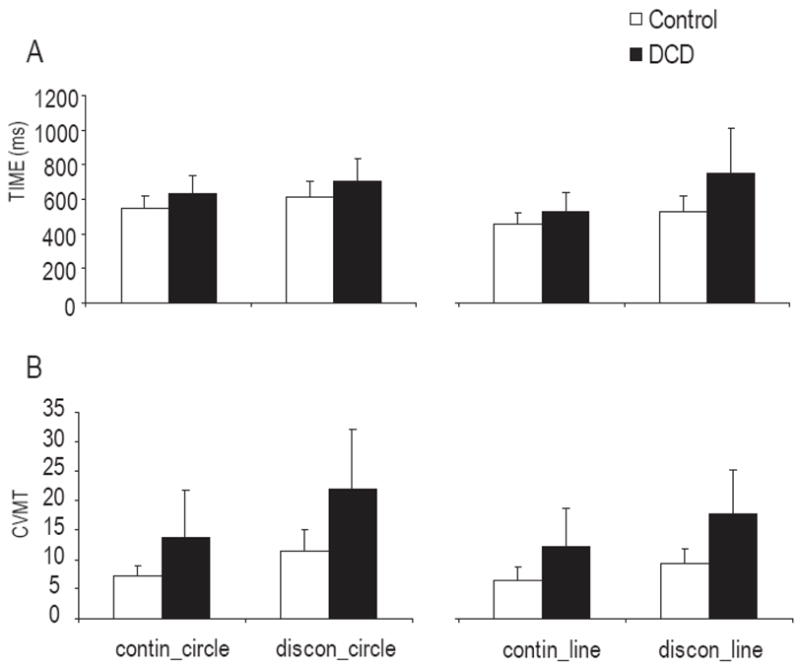
Mean MT (A) and CVMT (B) between ten children with DCD and ten age- and gender-matched controls for four conditions (continuous circle, discontinuous circle, continuous line and discontinuous line drawing). The error bars denote standard deviations. Significant group and condition main effects for MT and CVMT were found.
The temporal variability, as measured by CVMT, showed significant group (F(1,18)=11.74, P=0.003) and condition main effects (F(3,54)=15.08, P<0.001). Both groups showed higher temporal variability in the discontinuous circling than in the continuous circling (F(1,54)=27.01, P<0.001). Higher temporal variability was also found in discontinuous line drawing, compared to continuous line drawing (F(1,54)=12.62, P<0.001). Furthermore, the temporal variability in discontinuous circling was higher than that in discontinuous line drawing (F(1,54)=6.25, P=0.015). The children with DCD moved with higher temporal variability than the controls in all conditions (Fig. 1B). No interaction between groups and conditions was found, suggesting that the high temporal variability was not restricted to the discontinuous drawing in the children with DCD.
The spatial variability between movement trajectory and template also varied significantly across conditions (F(3,54)=18.39, P<0.001) as RMSE scores were higher for the continuous circling (mean (SD) =0.79 (0.36)), and the discontinuous circling (m=0.57 (0.29)) compared to the continuous line (m=0.32(0.14)) and discontinuous line drawing (m=0.30 (0.12)) (Fig. 2A). The spatial variability in the discontinuous circling was also significantly higher than that in the continuous circling (P<0.001). No statistically significant group differences were found for TD or RMSE. However, spatial variability across repetitions, as measured by CVTD, showed a significant main effect for group (F(1,18)=6.13, P=0.023) and condition (F(3,54)=3.12, P=0.033), indicating that, similar to the temporal variability measure, the children with DCD moved significantly more variably in the spatial domain than the controls (Fig. 2B). The condition main effect was due to the higher spatial variability in the discontinuous circling than that in the discontinuous line drawing (F(1,54)=6.67, P=0.013).
Figure 2.

Mean RMSE (A) and CVTD (B) between ten children with DCD and ten age-and gender-matched controls for four conditions (continuous circle, discontinuous circle, continuous line and discontinuous line drawing). The error bars denote standard deviations. A significant main effect for condition was found for RMSE, as were for group and condition for CVTD.
In order to stratify performance of the children with DCD individually, the confidence intervals based on the children who were typically developing were calculated to define the ‘normal’ performance range. The age regression on CVMT, shown in Figure 3, illustrates the individual temporal variability in each of the drawing conditions. In the continuous circling, two out of ten children with DCD exceeded the range of temporal variability defined by the typically developing subjects. In the discontinuous circling, five children with DCD had higher temporal variability than what was defined as within normal range. In the line drawing conditions, the CVMT scores were higher in three children in the continuous and seven in the discontinuous drawing. To illustrate this further, a Venn diagram (Figure 4) was used to place the children with high temporal variability in the respective task condition. Two children (#2 and #7) showed generally higher temporal variability in all tasks, and one child (#10) revealed poor temporal consistency only in the discontinuous circling. Two children (#1 and #6) showed higher temporal variability in both types of the discontinuous drawing. In addition, there were three children (#3, #5 and #8) showed impaired timing only in the discontinuous line drawing conditions. One child with DCD (#9) had higher temporal variability only in the continuous line drawing tasks, and one (#4) showed normal performance in all four conditions.
Figure 3.

CVMT for individual children with DCD (large solid dots) and thirty-one children who are typically developing (Empty squares) in four conditions: A) continuous circle, B) discontinuous circle, C) continuous line, and D) discontinuous line drawing. The solid line represents the age regression and the two dash lines represent the upper confident limit (UCL) and lower confident limit (LCL) based on the children who are typically developing.
Figure 4.
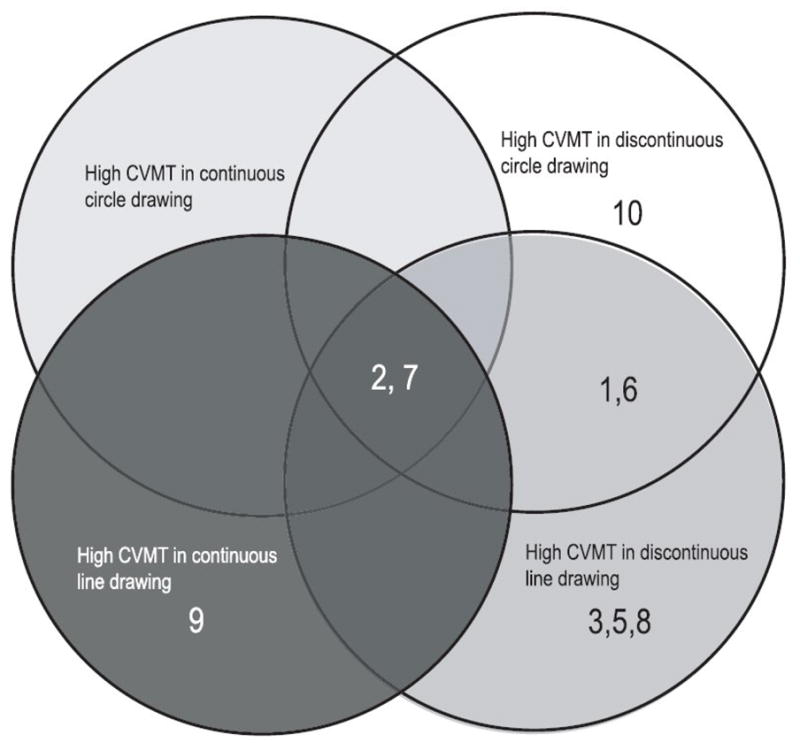
Venn diagram for individual children with DCD who had higher CVMT scores compared to UCL denoting the upper confidence interval based on the children who are typically developing in four conditions. Each number refers to an individual child with DCD.
The current study examined whether children with DCD had restricted timing deficits in discontinuous versus continuous movements in order to investigate a possible involvement of the cerebellum in the timing deficits observed in DCD. It also sought to determine whether the timing variability often found in DCD decreased when the complexity of limb dynamics decreased. Group comparisons revealed that children with DCD did not appear to be selectively impaired in discontinuous movements. Decreasing the dynamic complexity of the drawing task improved the temporal consistency in both children with and without DCD at very similar rates. These findings suggest that ‘explicit timing’ is not the only mechanism to explain the temporal difference between continuous and discontinuous drawing for children. A similar phenomenon has been observed in our recent study, in which we examined whether motor performance of patients with cerebellar lesions would improve when they were provided with external timing information[3]. We found that both cerebellar patients and controls had higher temporal variability in the discontinuous compared to continuous circling. Surprisingly, temporal precision in cerebellar subjects has been worse when a constant visual cue was used to compensate for event timing deficits, suggesting other mechanisms besides timing are involved. In view of the current results in typically developing children, other developmental studies[4;12], and our previous findings in cerebellar patients[3], we think that in evaluating the “timing deficit”, the limb dynamic differences between continuous and discontinuous drawing need to be considered since drawing discontinuous circles requires more distinct switching on and off of certain muscle groups than do continuous movements. Additionally, since the DCD population is very heterogeneous, it is important to look at individual performance, in order to better understand the mechanisms of temporal control in these children: This is where the diversity in performance becomes obvious, as opposed to looking at group performance which did not indicate selective timing deficit in children with DCD.
A number of previous studies have extensively described the diverse characteristics of children with DCD[13;16;20]. Lundy-Ekman et al.[13] reported that the cerebellar signs corresponded with a deficit in timing control while basal ganglia signs did so with a deficit in force control. Volman and Geuze[20] used a similar grouping method but did not find support for cerebellar involvement in the timing deficit in children with DCD. Since the arbitrariness of criteria selection for different grouping methods (e.g. the soft neurological signs[13], or the performance on fine and gross motor tasks[16]) presents a limitation, we evaluated the children with DCD individually with respect to the overall performance of children who were typically developing. Five children with DCD showed higher temporal variability in the discontinuous line drawing, with two out of these five also having timing problems in the discontinuous circle drawing. As mentioned earlier, the dynamic control in the circle drawing was more challenging than that in the line drawing. Thus, the comparison between the discontinuous and continuous circling combined the problems in both the limb dynamic and timing controls. The variability caused by dynamic control in the typically developing children might have overshadowed the timing deficit in certain subtypes of children with DCD when we asked children to draw circles. When the dynamic control became simpler in the line drawing tasks, the timing deficit in the discontinuous line drawing emerged more clearly in one subgroup of children with DCD. In the current study, three out of ten children who did not show differences in the circle drawing appeared to have limited timing deficits in the discontinuous line drawing. We argue that this restricted timing problem implicates a cerebellar ‘explicit timing’ impairment, as suggested by other studies, indicating a possible link between compromised cerebellar function and the timing problems in both animal studies[7] and human experiments[10].
In summary, our findings support the notion of a compromised “explicit timing” (higher variability in discontinuous movements), or a compromised “dynamic control” (higher variability in drawing circles) or both (higher variability in drawing discontinuous lines but not circles). The heterogeneous nature of the DCD population is further confirmed by individual analysis. In view of our findings, it is likely that certain subgroup of children with DCD have some relatively restricted dysfunction (e.g., of the cerebellum), while others have problems, possibly involving a wider neural circuitry. In this context, individual analysis using a developmental landscape of typically developing children’s performance over a specific age range offers a useful approach to understanding the mechanisms underlying DCD.
Acknowledgments
This work was supported by National Institutes of Health HD42527 (to JEC). The authors wish to thank all the children and their parents who gave willingly of their time and effort.
Footnotes
Publisher's Disclaimer: This is a PDF file of an unedited manuscript that has been accepted for publication. As a service to our customers we are providing this early version of the manuscript. The manuscript will undergo copyediting, typesetting, and review of the resulting proof before it is published in its final citable form. Please note that during the production process errors may be discovered which could affect the content, and all legal disclaimers that apply to the journal pertain.
References
- 1.APA. Diagnostic and Statistical Manual of Mental DisordersTM. American Psychiatric Association; Washington, DC: 2000. [Google Scholar]
- 2.Beery KE. Developmental Test of Visual-Motor Integration. Modern Curriculum Press; Parsippany, NJ: 1997. [Google Scholar]
- 3.Bo J, Block H, Clark JE, Bastian AJ. Can cerebellar motor performance be improved by explicit timing information. Paper presented at the meeting of the Society for Neuroscience; 2005. [Google Scholar]
- 4.Contreras-Vidal J, Bo J, Boudreau JP, Clark JE. Development of visuomotor representations for hand movement in young children. Exp Brain Res. 2005;162:155–164. doi: 10.1007/s00221-004-2123-7. [DOI] [PubMed] [Google Scholar]
- 5.Geuze RH, Jongmans MJ, Schoemaker MM, Smits-Engelsman BC. Clinical and research diagnostic criteria for developmental coordination disorder: a review and discussion. Hum Mov Sci. 2001;20:7–47. doi: 10.1016/s0167-9457(01)00027-6. [DOI] [PubMed] [Google Scholar]
- 6.Geuze RH, Kalverboer AF. Inconsistency and adaptation in timing of clumsy children. J Hum Mov Studies. 1987;13:421–432. [Google Scholar]
- 7.Gramsbergen A. Clumsiness and disturbed cerebellar development: insights from animal experiments. Neural Plast. 2003;10:129–140. doi: 10.1155/NP.2003.129. [DOI] [PMC free article] [PubMed] [Google Scholar]
- 8.Handy TC, Gazzaniga MS, Ivry RB. Cortical and subcortical contributions to the representation of temporal information. Neuropsychologia. 2003;41:1461–1473. doi: 10.1016/s0028-3932(03)00093-9. [DOI] [PubMed] [Google Scholar]
- 9.Henderson SE, Sugden D. Movement Assessment Battery for Children. The Psychological Corporation; London: 1992. [Google Scholar]
- 10.Ivry RB. Cerebellar involvement in clumsiness and other developmental disorders. Neural Plast. 2003;10:141–153. doi: 10.1155/NP.2003.141. [DOI] [PMC free article] [PubMed] [Google Scholar]
- 11.Ivry RB, Spencer RM, Zelaznik HN, Diedrichsen J. The cerebellum and event timing. Cerebellum: Recent Developments in Cerebellar Research. 2002;978:302–317. doi: 10.1111/j.1749-6632.2002.tb07576.x. [DOI] [PubMed] [Google Scholar]
- 12.Jansen-Osmann P, Richter S, Konczak J, Kalveram KT. Force adaptation transfers to untrained workspace regions in children: evidence for developing inverse dynamic motor models. Exp Brain Res. 2002;143:212–220. doi: 10.1007/s00221-001-0982-8. [DOI] [PubMed] [Google Scholar]
- 13.Lundy-Ekman L, Ivry R, Keele S, Woollacott M. Timing and force control deficits in clumsy children. J Cogn Neurosci. 1991;3:367–376. doi: 10.1162/jocn.1991.3.4.367. [DOI] [PubMed] [Google Scholar]
- 14.Miyahara M, Piek J, Barrett N. Accuracy of drawing in a dual-task and resistance-to-distraction study: Motor or attention deficit? Hum Mov Sci. 2006;25:100–109. doi: 10.1016/j.humov.2005.11.004. [DOI] [PubMed] [Google Scholar]
- 15.Nicolson RI, Fawcett AJ, Dean P. Developmental dyslexia: the cerebellar deficit hypothesis. Trends Neurosci. 2001;24:508–511. doi: 10.1016/s0166-2236(00)01896-8. [DOI] [PubMed] [Google Scholar]
- 16.Parker HE, Larkin D, Wade MG. Are motor timing problems subgroup specific in children with developmental coordination disorder? The Aust Educ Dev Psychol. 1997;14:35–42. [Google Scholar]
- 17.Smits-Engelsman BCM, Niemeijer AS, Van Galen GP. Fine motor deficiencies in children diagnosed as DCD based on poor grapho-motor ability. Hum Mov Sci. 2001;20:161–182. doi: 10.1016/s0167-9457(01)00033-1. [DOI] [PubMed] [Google Scholar]
- 18.Spencer RMC, Zelaznik HN, Diedrichsen J, Ivry RB. Disrupted timing of discontinuous but not continuous movements by cerebellar lesions. Science. 2003;300:1437–1439. doi: 10.1126/science.1083661. [DOI] [PubMed] [Google Scholar]
- 19.Volman MCJR, Geuze RH. Relative phase stability of bimanual and visuomanual rhythmic coordination patterns in children with a Developmental Coordination Disorder. Hum Mov Sci. 1998;17:541–572. [Google Scholar]
- 20.Volman MJM, Geuze RH. Stability of rhythmic finger movement in children with a developmental coordination disorder. Motor Control. 1998;2:34–60. doi: 10.1123/mcj.2.1.34. [DOI] [PubMed] [Google Scholar]
- 21.Wann J, Wing AM, Sovik N. Development of Graphic Skills. Academic Press Limited; London: 1991. [Google Scholar]
- 22.Williams HG, Woollacott MH, Ivry RB. Timing and motor control in clumsy children. J Mot Behav. 1992;24:165–172. doi: 10.1080/00222895.1992.9941612. [DOI] [PubMed] [Google Scholar]
- 23.Woodcock RW, Johnson MB. Woodcock-Johnson Psycho-Educational Battery-Revised. DLM Teaching Resources; Allen, TX: 1990. [Google Scholar]
- 24.Zelaznik HN, Spencer RMC, Ivry RB. Dissociation of explicit and implicit timing in repetitive tapping and drawing movements. J Exp Psychol Hum Percept Perform. 2002;28:575–588. doi: 10.1037//0096-1523.28.3.575. [DOI] [PubMed] [Google Scholar]