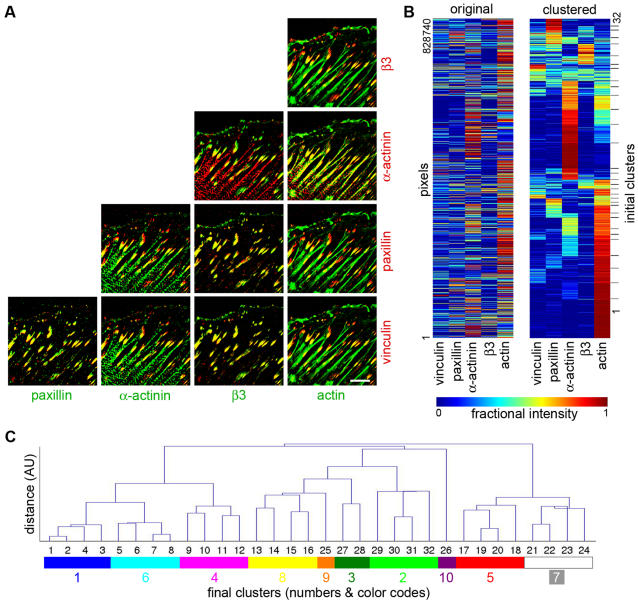
Figure 2. Identifying compositional signatures of adhesion sites by cluster analysis.
REF52 cells were subjected to: no treatment, Y-27632, and Y-27632 with a subsequent recovery period of 3, 15 or 60 minutes. The cells were then fixed, labeled for vinculin, paxillin, α-actinin and actin, and their 5-color images (including β3-integrin-GFP) were analyzed. For each of the 5 treatments 4 cells were sampled, creating a pool of 20 cells. (A) Images showing a single non-treated, 5-color-labeled, cell in all 10 possible combinations of 2 components superposition images. Scale bar, 10 µm. (B) A matrix presenting the composition of all pixels above background in the 20 multicolor images (original). Color indicates the fractional intensity of a given component in each given pixel. The rows were then reordered according to the top-down clustering algorithm[24] based on compositional similarity (clustered). The process was deliberately designed to over-divide the data into 32 clusters. (C) Bottom-up merging of the over-divided clusters. The dendrogram presents the hierarchical distance between the merged clusters during the merging process. The significance of each cluster along the merging process (i.e. each node in the dendrogram) was further evaluated visually, based on the spatial coherence of the sub-cellular distribution of its pixels. Thus, the initial 32 clusters were merged to 10 final ones, which define compositional signatures, and were assigned distinguishable colors for visualizing their sub-cellular distribution.

