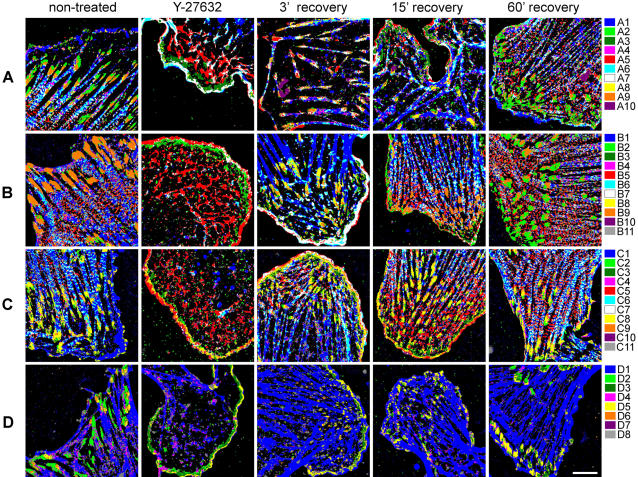
Figure 4. Sub-cellular localization of the compositional clusters in non-treated and treated REF52 cells.
Images of the 5-components-labeled cells, in which each pixel is colored according to its cluster assignment (the color-code is indicated on the right, and is consistent with Fig. 3). The rows correspond to the four labeling sets (A–D), as shown in Figure 3. The columns correspond to treatments (non-treated, Y-27632 treatment, and Y-27632 treatment with a subsequent recovery period of 3, 15 and 60 minutes). Scale bar, 10 µm.

