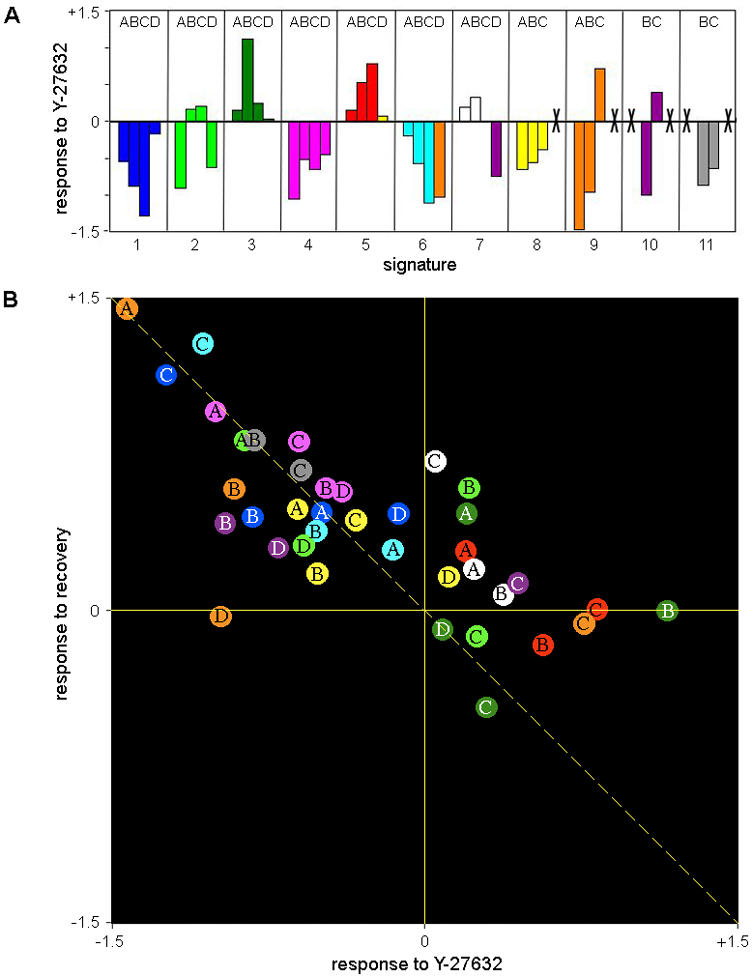
Figure 5. The effect of Rho-kinase inhibition and recovery on the abundance of compositional signatures.

(A) The number of pixels assigned to each signature was counted in non-treated cells and in cells treated with Y-27632 (based on Fig. 4 and Supplementary Figs. S1, S2, S3 and S4). The response of each signature to Y-27632 was then defined as: Log(number of pixels in Y-27632 treated cells/number of pixels in non-treated cells). Thus, positive values indicate increase in abundance, negative values indicate decrease and zero indicates no change, in response to Y-27632. Crosses exclude letter-number combinations that do not correspond to a defined signature (according to Fig. 3), or that correspond to signatures defined as noise (see Fig. 3) or signatures absent in non-treated cells (see Table 2). (B) Changes in the abundance of compositional signatures in response to Rho-kinase inhibition and following its recovery. Each position of each signature in the scatter plot is determined by its response to the Y-27632 treatment (horizontal axis) and to the recovery treatment (vertical axis). The response to Y-27632 was calculated as described for (A). The response to recovery was calculated as Log(number of pixels after recovery of 60 minutes/number of pixels in Y-27632 treated cells). The signatures are marked with a letter A–D, indicating the particular labeling set, and a color indicating its number, consistently with Figure 3. The diagonal dashed line marks the expected trend if the response to Y-27632 and the recovery were exactly opposite processes.
