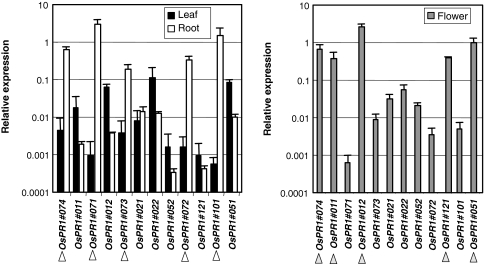
Fig. 4.
Organ-specific expression of OsPR1 genes Leaves and roots of the seedlings at the fourth leaf stage (left panel), and flowers of adult plants (right panel) were subjected to qPCR analysis. Relative expression levels compared with that of the control actin gene are shown. The genes that express at a high level in roots and flowers are marked with white and gray arrowheads, respectively. Bars indicate mean ± SD

